3 Financial Analytics: Balance Sheet and P&L
DataSelf AI shows how to build financial reporting in Excel and Tableau, automating month-end consolidation and cutting manual work. The Tableau dashboards let you drill down from years to months to GL accounts, handle multi-company consolidation, manage exchange rates across currencies, and set row-level security so users see only their data.
Chapters
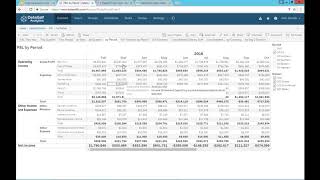
Now I'm going to jump into the more traditional reporting balance sheet and profit and losses. I'll cover all of this content and I'm going to start showing a little bit on Excel. You know, many people use Excel, many people love Excel, many people hate Excel. When many people come to us, sometimes they want to get out of Excel because it's time consuming, is labor intensive. But sometimes Excel is the right tool and we have usually the knowledge of the expertise to understand your needs and tell you which way you should go. So I'm going to start showing first the Excel framework that we usually use when clients want to use Excel as a front end. But I'll focus most of my presentation about this on tableau because many people come to us because they have tableau and they don't know how to do financials in tableau. So I'll spend more time in that side of the the puzzle. So in Excel, probably, you know, most of you are familiar with Excel and showing financial information. So this is just a simple comparative income statement where you see the accounts, you see in this case two years, the actual how much, how much percent of these things represent the growth since last year from a number standpoint as well as the percentage. Some of the things we do that are really valuable for our clients with Excel and financials is the whole logic of crunching the financial information is done with our data warehouse framework. So for those companies who are spending hours and hours and hours to get their financials built and distributed and is licensed by division business unit, whatnot, typically our data warehouse will completely or do most of the labor completely automated overnight, every day, at the end of the month, at the end of the quarter, whatever it is. So you can focus on having insights from this information instead of doing things manually. So the way that it looks, you can make any kind of shape or form the formatting in Excel Budgeting also very popular for Excel using. Some people only use Excel to see the budget. Some people like to use Excel as a data input. We support both framework. We have add ons to Excel that if you want to change the information and push it back into the repository like the data warehouse. So each user that will do the data input into the budget, they are doing this change, but the information is secured once they press submit. That change that they did only will apply to the fields that they can change and would automatically be consolidated across all users, all divisions. And then people will be able to start to slice and dice the budget based on the user inputs. So Excel in some companies Very popular to be used in the BDS with data Self. With our data warehouse, we dramatically reduce the time that it takes to get financials budgets into Excel because the data warehouse will automate procedures that today usually people are doing manually. So that's pretty much a quick overview of the Excel, many possibilities. But if you have more questions, we can talk on a one on one basis. Now let me show you balance sheet product losses in the Tableau framework. So let me switch to Tableau here and by the way, let me change my screen here very quickly and what I'm going to do now is go to my favorites. By the way, in Tableau, Tableau makes a way that you can easily find things that are very popular to you. So I added into my favorites here I'm going to go and look at P and L this year. And when I go to P and L this year, I have actually several tabs that are part of this workbook. And this is a very traditional P and L in tableau. The format is not the traditional format the way that the layout is, but the sort of the buckets, how they are aggregated is exactly the same way. So you see gross profit, you know, revenues, cost of sales, and this is the gross profit. You see expenses with all the accounts. The total of the expenses here in this is the gross operating income, then other expenses and then at the end net income. Very simple format that I have here, but it gives information and the building tableau as things can be easily changed. Users can easily slice and dice and drill down if you give them the power to do so. For instance, if I want to drill down from this level to one level in more detail, I just click the expand button and right there I go and I break down each of these accounts into their sub accounts. I can keep on drilling down, going to the actual GL chart of accounts. You can drill down from year. I can drill down and go, let's say to quarter. I can drill down and go to months. Very interactive and you control what you can let your users do. But they're interactive. You can have business units, divisions, let's say I just want to see, you know, my headquarter P and L. So I remove the other divisions, business units right there the report changes to only show my headquarter P and L out of the box. We have hundreds of reports covering balance sheet and profit losses and variations. Here we have only a few showing, let's say I want to see by period. So in this case for all my databases, shows P and LS by period. So you don't have to build those reports or just plug and play. If you want to see variances, you just let's say go to the variances out of the box. We have a lot. In this case it's showing for the current month, which my sample database is May shows last year, this year, how much has been posted, what is the variance in a dollar amount and what is the percentage variance since last year. So financials, we cover a lot of these different options. Now let's talk a little bit about multi company. Many people, when they come to us with the financial challenges because they have more than one company and they need to consolidate. It's time consuming, it's complex and is slow. So let me give you some examples that once we bring the multi company databases into the data warehouse and you can have any ERP system, you can have a Sage, ERP system, Acumatica Dynamics, whatnot, we can bring those data together and we can show consolidated reports like this one for instance. This is just an example where I have right now my P and L for my headquarters. So this is one company that has P and L. But then I have four other companies that actually are only for revenues. They are not cost centers. And if I want to see the P and L for them side by side with my headquarters, I just come here and I check. I want to see with Northern when I see with Southern and I just pick and choose in this P and L kind of, you know, gets additional columns, each one for the different company. If these other four organizations would be completely with all the cost centers then all of these other buckets will be populated and you have a P and L by each of those companies and also a consolidated one. So this is one way that we can show, let's say in columns and we can build secure in a way that, let's say if I'm the general manager manager for the Western company, when I open this dashboard, I only see the Western while the CFO of the headquarters opens because this person can see everything. All columns are available. So security can control what people will see. And this is automatic. You don't have to be switching gears. You just send to everyone the same report and security will take care of what they can see. Another way of looking at consolidated financials is actually looking on a vertical way. So here I have my operating income just for all consolidated. But then I can drill down from the consolidation into my actual individual business units. So the top here in this whole white band I have the P and L for headquarters and here is the business unit, net income. If I scroll down I have P and LS at the bottom. This orange bar is a P and L for Northern and then this is the P and L for sudden and so forth. So again if you have cost centers, this P and L will be vertically, not horizontally. As I showed before, many people that have multi company, they also have intercompany transactions that sometimes it's very hard to eliminate them from the actuals. And we have a lot of experience in looking at how you're doing those multi company transactions and how to help you in the BI platform to incorporate them a way that they become completely transparent as you run financial. So if you have intercompany transaction challenges, let's talk on a one on one basis so we can help you understand how we can address those. Many people also have multi currency systems that they post in their ERP system their financials, different currencies. Right here what I'm showing is an example of P and L where we have post transactions were done in US dollar, Canadian dollar and Euros. This report is already showing all of them converted into the functional currency which is US dollar. So right now this is a US dollar financial, but it's splitting in different columns of how much was posted on each of these other currencies. Now if you want to see the actual amounts in the source currency, you can come here and say show my source currencies. So right now what I'm doing is for each one of these columns I have US dollar converted but I have the amount in the source currency. So in this case is the same. So we have a match for Canadian, the source currency is a little bit higher than the US dollar and for Euro it's a little bit lower. But then right here you can see the conversion. If you want to see what was the conversion rate, you can click here and see at the high level how much the exchange rate was applied. So you just pick and choose and you have the insight. Finally, you probably have a lot of GL segments and sometimes people need to slice and dice their financials by different GL segments. Out of the box we have three segments but you can add 4, 5, 10, 20, as many as you have. And then you can start seeing your PNLs looking at your segments. Like in this case I'm looking at segment two as different columns or as different blocks horizontally. So this is the P and L framework in Tableau. As you can tell the formatting is not the traditional one like you can do in Excel. However, the information is correct, it's accurate, it's automatic, and you can drill down as slice and dice it very, very easily. It's very powerful. Just show a little bit of balance sheet. Balance sheet is the same concept. So I'm not going to go over all of these tabs and explain, but overall, you know, we have a balance sheet you can drill down into more details. You can drill down from the years to the quarters to the months. Kind of the same idea as I showed the P and L. But looking at balance sheet information.










