A demo-style video (DataSelf AI) explaining budgeting and forecasting analytics using Tableau (and R for advanced forecasting). Covers ingesting budgets from ERP/Excel into a data warehouse, visualizing actual vs. budget with color cues, handling dominant accounts by excluding them to improve chart readability, and running interactive what-if scenarios (e.g., +10% sales) and forecasts (simple growth or statistical models via R).
Chapters
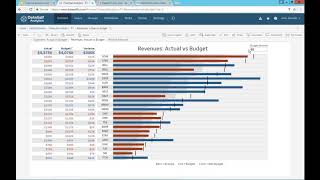
All right, now let's take a look at budgeting. So budgeting, Pretty much every company has a unique way of doing budgeting. And before we show what we can do with budgeting, I always ask, how are you doing your budgeting? What challenges are you facing and what would you like to improve? And based on those answers, then we can show different approaches we have taken with our framework to address budgeting needs. What I'm going to show you now is something very simple, more from an analytics standpoint. This example here is if you have budgeting coming from your ERP system or from Excel sheets, and then we just bring into the data warehouse, we consolidated the data and then we allow people to slice and dice the data. So this is a simple expense actual and budget. And the colors are showing that if you are over your budget, then it shows as in red. If you are below your budget shows as in green. So just a simple way to visualize that. Let me show a budget that is a little bit more sophisticated because sometimes people like to look at budgets from a number standpoint. Sometimes they like to see budget budgets also with the charts and see trends. This budget here is something that I see fairly often when people put information on charts in charts, sometimes because you might have one or two accounts that are so big they make everything else so small that the chart doesn't tell much. It's kind of a waste of real estate on your screen. But overall, with this framework and take advantage of tableau, you can come here, you see how your actual budget and variance are for the whole business. You see this main account, you act on the big account. But then I want to get rid of it. I want to take it out of the screen so I can focus on everyone else to see what's going on. I can easily click on this particular one and say, hey, exclude. So now once I excluded that one, and by the way, let me just show you what I just did. I'm going to undo that transaction. I just eliminated the top line. And by doing that, all the remaining lines become longer. And I can easily see, you know, the line is the budget. The color of the bar is if above or below. So if it's above, budget is blue. If it's below, it's orange. Because this is a revenue budget. So we want people to be always above the budget. And in here, the budget in this example was input by the account managers. So they entered into an Excel file, they click a submit button. The budget goes to a centralized data warehouse that crunches all the data and then the VP of sales would approve those amounts, approve it, submits it, and eventually comes into something like this. Now, on a daily basis, sometimes they want to do what if scenarios or variations. What if we want to increase our sales by 10% and then more people now would be below the budget. So you can apply different ratios to see how things change by using that kind of parameter. Let me show a little bit of what if scenarios. In this case. We have actuals and forecast, we have the total, we have a bunch of accounts and then we have for this year all the months. And we we see a lot of numbers here. That numbers sometimes are hard to read even though again, blue means above forecast and orange means below forecast. These bars on the right are aligned with each one of these accounts and the bar is the actual, the line is the forecast, and the color scheme is the same. Above forecast is blue, below forecast is orange. So this is very easy to take a quick look to see the trends among each of these accounts. In here you can see also the total right now through August. So we are overall above our budget. And let's say you want to just eliminate the months that we're not yet looking at. You can come here and say, hey, let's just remove those par months and just focus on the months that we are right now past. Or maybe I just want to see the future one. So I'm going to say I just want to see the September, October because of the new months, just going to focus on those ones. So very interactive. I have here the icon of R. Many organizations have very sophisticated ways to calculate forecast in the tableau framework works really nicely with R. So it covers a wide range of forecasting needs. It can be simple just looking at last year, same period plus growth percentage. Or it can be more sophisticated. It can have user entry, it can look at these sophisticated statistical analysis to come up with the forecast. So the beauty is this framework allows you to go from simple to very sophisticated.