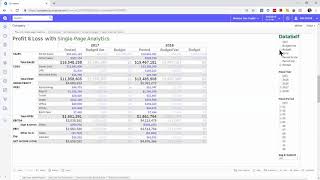
DataSelf shows how to view a full P&L statement on one page, then drill down from yearly totals to monthly amounts, GL accounts, and individual transactions. You can compare years side-by-side, toggle budget versus variance, and keep your filters when you come back.
Chapters
Data Self Single page analytics allows users to analyze their financials without going through multiple pages. For instance, in this example I'm looking at a single P and L in a single year. If I want to see the amounts by month, I just click on this plus signal and I can see the posted amount by month. If I want to drill down to see the GL numbers, I can expand clicking on this plus signal. If I actually want to compare years side by side, I can pick, let's say two years and there it is. Maybe if I want to see budget and variances, I just pick and choose those measures and I can see what's going on. Now suppose I'm analyzing these two years and I find something interesting like travel expenses have some kind of issue in my numbers. I can click on any of these data points and it will pop on the same screen details showing all the GL accounts, the sub accounts, the year, fiscal periods, debits, credits and posted. And if I want to see even more details, I can mouse over the fiscal period, click the plus signal and it will expand and I can see the batch numbers, transaction dates, source and descriptions. If I'm looking at number and I get a call or I get distracted when I come back from the call, I can see the whole P and L where I started my analysis, where I drill down, where I stopped all filters applied and that can help me get back into my line of thinking so much more quickly. And those are some of the benefits behind Data Self's single page analytics. Thanks for watching.