Acumatica Natural Language by DataSelf
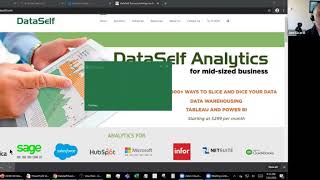
Johnny Girardi demos DataSelf's analytics for Acumatica, which pulls your data into a warehouse and lets you query it in plain English. Business users stop guessing at numbers. Pricing starts at $299/month, with a 14-day free trial.
Chapters
Happy Friday everyone. My name is Johnny Girardi. I'm Data Sales Founder CEO. First of all, I appreciate the time that you're making to learn more about dataself. I hope you're staying safe, well and sane. I hope that you like me. The biggest challenge is remaining sane because there are some people with much bigger problems out there. So hopefully that's our main problem. It's trying to stay sane. I'm going to jump right into my content today. I have some good things to cover. The main idea is to talk about analytics and artificial intelligence for Acumatica. How we empower business users as well as the IT and consultants to support the decision making process. So let's jump right into our presentation. Why people come to dataself. What are the main pain points that people come to data self There are two types of users. The first one is the business users and quite often they complain that they are flying blind, having easy visibility into what is in their Acumatica system or other systems. It's not simple, you know, the business changes every day and decision makers, company owners, salespeople, inventory management people, inventory forecasting, anything they have new question about the business. And quite often it takes time and expertise to get the data out of their systems. Like Acumatica. Acumatica has great reporting tools. Yes it does. But it's not as easy for business people to be self sufficient. So flying blind is one of the comments we hear quite often from business users when they talk about their data silos. When it comes to the people supporting the decision makers, you know, this could be IT people. They can be business analysts or people who are actually building reports and dashboards. The main complaint we hear is it's complex and time consuming. They got to do a lot of work. They gotta, you know, keep the system refreshing properly. They need to be able to share information with the right people. Refreshing reports. Many people use Excel as an add on to Acumatica. To get the data out of Akumatica, go to Excel, manipulate the data, create formulas, test the data and then email to people. Anyhow, summarizing complexity in time is the things we learn a lot from people. On the IT side there's a lot of details but these are the two main complaints or reporting challenges. Let me show you the technology we use from a very high level that facilitates in addresses those things. I'm going to keep this conversation very high level. So first of all what we do is we pull the data from Acumatica can be on premises, can be in the cloud, no Matter where your Qematica is. We get the data out of Acumatica and we put in a data warehouse. What is a data warehouse for? A data warehouse is an extremely powerful yet easy to use platform to tackle a lot of the complexity of reporting. Where are the tables, where are the fields, how to link the tables, how to refresh, how to run this in seconds, how to automatically push the data to users. A lot of those complex, time consuming jobs of IT people to maintain reporting can be tackled by data warehousing. I'm not going to go into the technical details, we're going to have other webinars or if you're a technical person, you want to learn exactly how this works. How can you do it as an IT people? Not today, but we make it easy. We make it affordable for you to provide data warehousing inexpensively, quickly for users. As a user, as a business person, we use technology available for Fortune 2000 companies. We make it simple, we make it affordable. At the end of the day, we're using Tableau Power BI in Excel as the user interface. And as a business user, we provide a lot of reports and dashboards that are easy to be accessed. If you have Internet, anytime, anywhere, on a mobile device, on a tablet, on a computer, on a Mac, whatever you have easy to see dashboards, easy to drill down to information, easy to use natural language to get data out of it. So that's how we do our magic. I'm going to keep it at very high level. Technical people, we can talk more later, but this is how we do the magic of simplifying addressing those issues in practical terms. Decision makers with data self, they have easy access to key performance indicators instantly, accurately, anytime, anywhere. Again, mobile devices, smartphones, tablets, computers, anytime they have a web, I'm sorry, an Internet connection, they can run the reports in seconds. They can slice and dice information. I'm going to show some examples in the product presentation. If you are a person supporting the decision makers, you know it, business analysts, consultant, whatnot. What we do is what I showed you in the last page, the data warehousing tableau, Power bi, all those things, we make it super simple. The setup, the maintenance, and we help you automate reporting mechanical tasks. If you're doing a lot of mechanical things to get the report out to people, to refresh it, to test it, to send subscription alerts, we can help you be a lot more effective using the latest and greatest technology. So that's what we do to IT people. Let's jump into a product demo. I'm going to show primarily two pieces of the solution. One is how users, business users can extensively take advantage of it. Second, I want to show some of the IT work. So if you're an IT person, a consultant, business analyst, I'm going to show some of the pieces that you will be learning so you can support the decision makers. And I'm going to talk a little bit about the back end as well. So you have a little insight from it. So you get a little bit of, you know, the whole data self component. So I'm going to switch now to web browser where I have a Ecumedica instance and Data self is already embedded inside of Acumatica. It's optional. You can have data self inside of Acumatica or only outside of Acumatica or both. You know, maybe you have some users like board members, outside salespeople that do not have access to Acumatica but they, they might need information from Akumatica or something else. So you can have them completely outside of Acumatica. In my demo right now I'm going to be showing inside of Akumatica. In the first part of my demo I'm going to be using the Data self natural language in artificial intelligence component that is extremely powerful for non IT people to be able to find answer to their questions anytime, anywhere by talking with the computer. You know that's natural language query and it's very similar to searching the Internet like Google or Bing. If you search the Internet you get hits and you get articles in data self. If you search in data self the source data is ecumatica or anything that is in dataself could be Acumatica, could be your payroll, could be, could be your Google Analytics, anything. Data self. You can ask data self a question, it will show you the hits you select and then the solution builds a report on the fly with the accurate instant answer. Let's see it. So right now I am in the natural language component for sales analysis from Acumatica and let's assume I am the VP of Sales or maybe a salesperson, maybe the CEO. It may be I want to see sales by salesperson by month in 2019 I want to see that report. And suppose this report does not exist in my system. I just go to this box and I type sales by salesperson by month by month in 2019. So I typed the question just in English. The tool uses natural language in artificial intelligence to try to make sense what the person wrote. By the way, I accidentally misspelled salesperson was not intentional. Still the tool Found two hits. The second hit is sum of sales by salesperson. Yep, I want to see that by invoice dates, month. Yep. But when sales equal 2019. No, no, no, I don't want to see sales equal 2019. What I want to see is the first hit where the invoice date is 2019. So just like in, you know, in Google, I see the hits, I select one of them, and then the magic happens. The tool will build a report accurately, instantly, with the answer to that question. It's like magic. In this case, in 2019, by month, by salesperson, it gave me a line chart. It's that simple. You write a question. If the tool understands your question, it finds data points. And in your database, it will build a report. Now, many people, when they look at this report, let's say you are an accountant, the cfo, you might want to see numbers by the penny. Maybe you don't like charts. Whoever you are, you can come to this dropdown and select a different representation like a tax table. And if I choose tax table, that report now is converted to like a tabular report, like an Excel file. It's that easy if you know how to search the Internet. Now, you can build reports just by asking in plain English. And some users use this to get the data out into PDF, Excel and whatnot. Let me show how I can do it. Suppose I look at this whole year report and I want to see in January. I want to take these data points in January and and export to Excel and do whatever I want to do in Excel. So I just selected those data points. I go to the tool and I say, show me the data. I'm going to click View data. Now, the tool will get the data set January and put on a separate tab in the browser. I want to see everything. I want to see all the numbers, the underlying data, the invoice number, the invoice, invoice, date, quantity, sold. I want to see everything and I want to export this data into Excel. So now, in a few clicks, I found the data and now is in Excel, everything. And if I want to do more manipulation, if I want a slice and dices for an Excel, whatever you want to do, you do in Excel. The point is with natural language, without knowing tables, general generic inquiries, whatever, I just type to the computer. If it finds the answer it gives me, it is that simple. I'm going to shoot two more examples on natural language. I'm going to click the clear all. So I'm going to. Okay, I got that answer question. Now I want to see my top 10 products by sales in April, April 2019. So a different question. The tool is reading what I wrote, trying to make sense out of it and show me the hits. In this example I want to see Yep, the top 10 products by Sum of sales where the Invoice date is April 2019. That's exactly what I want to see. I'm going to click that option and again magic happens by product. I see sales in a descending order where the top 10, the top 10 is showed in blue and they decided to show the others in gray. So it give me both of them. So that is. And again if I want to see this information in a tax table, I just select tax table and now that report shows me top 10 products by sum of sales April 2019 as a tax table. Last example of natural language. I want to see gross profit by state by year as a map and what you get Magic. Again, the tool understood my question and it put gross profit as a color legend you saw in my sample database. I have two years. He plotted a map where darker gross profit, darker blue is more gross profit. The other side of the color, which is probably a little bit of red is a negative gross profit. Natural language is not designed for consultants. Yes, consultants in IT can do it absolutely. But they usually learn more and they can learn how to edit reports and dashboards and I'm going to show you in a minute. But natural language is extremely empowering for non techies. You know, business users, salespeople, company owners, board members, VP of finance, anyone that does not have time to learn complex reporting tools. They can use natural language, today's English only natural language to get answers to the questions. Anything data self acumatic or any data in data self people can ask questions. All right, so what I just showed again for business users, I'm going to show one more example of business user functionality and then I'm going to show some for the technical people, for the consultants and IT people. So I'm still talking with business users and I'm going to go now to the next tab. This tab here is a dashboard available out of the box. A dashboard like this, you cannot build with natural language. No you can't. Natural language is like Google. There's a lot of answers out there, but it does not have answers to all your questions. Quite often you have questions about your data that you need to talk to the consultants, to the IT people, to the business analysts. And these people will go through training to learn how they can take data self and build insightful dashboards like this one. Now once you give a dashboard like this one to a business user, I'm going to show how empowering a dashboard like this is in how much better they are than the built in dashboards in acumatica. In Acumatica can you build a dashboard that looks like this one? Yes, you can build something that looks like this one. But what you cannot do in acumatica dashboard is what I'm going to show you the interactivity you can do in dataself. So let me explain this dashboard and show an example. Suppose I'm VP of sales and right now I'm looking at year over year sales, this year, last year in the variance and I can see the dark blue which is this year I can see the trend analysis by month. So in this year you know I have a full nine periods because right now my simple database is through 10-8-2019 and then I have, you know, right now this 10/8 I have some sales and no sales for October for the rest of the year. And last year the, the light blue I have a full year. Well let's say I want to compare year to date analysis only a third quarter, whatever. I want to make a subset of my year I can come to the right and let's say I want to unselect periods 12, 11 and 10. I press apply. So I want to do a year comparison through the period 9 press apply. Now the whole dashboard changes so far not too different than acumatica. So I see, you know right now I'm growing on a year to day basis. I can see by period harm I'm doing, I can see by geography. Black bubbles is I'm growing since last year. Red bubbles I'm declining in a year to day basis. So if they put the mouse over Texas I'm growing 38% since last year to date. If I put the mouse over Louisiana I'm declining by 16%. So interesting. Then I can see my customers prior year, this year variance products and information. Now if I am the VP of sales and I look at this information, I like know, oh look at this, my top customer by sales this year is declining a lot in sales and I have another customer declining a lot. Huh, how about that? In Akumatica if I click on this customer it goes into a GI and it shows me all the data. All sales in 2017 if you have a lot of data, that's a lot of data. Maybe I'm not ready yet to look at all the data. Maybe I want to see trend analysis first let's say let me sort and see my top customers last year. So right now I'm searching this, sorting this report by sales last year and look at this, two of my top customers last year have major declining sales. That's not good. I'm going to select the two of them. I'm going to select the first customer and I'm going to select the third customer by sales last year. So I'm selecting these two customers. This you cannot do in Akumatica selecting some data points and when I selected these two customers the whole dashboard changed to show me the total for these two customers, the total trend analysis, the total ship to locations and all the products sold. Ah, products sold. So maybe they are affecting my sales for these customers. Let me sort and see which products are driving decline. Wow, look at this. These five products are having a major decline with those two customers. So I select the five products and now the whole dashboard changes again to only focus on those products. This interactivity within a dashboard you cannot do in Acumatica. But suppose that I'm at this point in data self and now I want to go to a GI level information for this subset of information I can do that of course I click see sales details and when I click on the sales details it will open at the bottom of the report of the dashboard like a GI showing for the last year and this year for these two customers for these five products, every single detail associated with them. Quantity sold, sales amount, invoice number and if I need to export to Excel I just go to this area and I click download and you can export to Excel and get information to Excel. So this whole interactivity with a dashboard it's not available in Acumatica. As a business user if you show to a business person what you can do here, you show them you don't need to train them, you show them in five minutes they will figure out there's a lot of dashboard. They can just go there, point and click and sort and download. Is very intuitive, very empowering. In out of the box we have many of these dashboards pre configured that can be easily customized. Maybe you want to see this by project. Maybe you have a construction business, maybe you work with services, maybe you have e commerce platform. These things out of the box are available many dashboards and you can easily customize them and that's what I'm going to show you next. So this first part of the demo is for business users how they can interact with the reports and dashboards, how they can drill down and how they can use natural language. My next part of the demo is showing a little bit to those of you who are consultants, who are IT people, Business analysts, the people that usually have to build reports and dashboards in Acumatica. I'm going to show how you do that in Data Self and at the end of the demo I'll show you a little bit how you can do the back end, the data warehousing framework. So it's a little bit more technical, but not so much even if you're a business user. You can probably be able to follow along with my exercise. So right now I am in the Data Self report designer, the equivalent of acumatica report designer in the Acumatica dashboard designer. In Acumatica there are two different tools. Data Self is a single tool that you can build reports and dashboards and it's much easier. I'm going to build in the next 5, 10 minutes a dashboard from scratch that is similar to what I was showing you before as a pre configured dashboard. This new dashboard we're going to build from scratch is going to have three different widgets. I want to see sales by customer, by product, by year. So I want to see a tabular report. Then I want to see sales and gross profit trend over time and then I want to see sales by territory, by state. So right now this solution is plugged or connected to an acumatica system through GI's. In pulling all the sales data from those GI's into data self automatically, the system just automatically, automatically refreshes it. And when I go to this list I see the fields that are pulling from the GI from the generic inquiries like branches, customers, document, date, invoice number, product information, you name it and then sales, cost of sales and gross profit. I'll show you later how that's being extracted, but right now is already listed here. To build a report I want to see sales by customer, by product, by period. What I do is I find customer here I drag to my rows, so this is all my customers in my Acumerica database. I want to see sales I drag to my report. Super easy drag and drop. So this is the total sales by customer in my whole company history. Well, I want to break down by fiscal period. I drag fiscal period to my columns and by default it puts my years. If you want to go back to the period level, I can expand year and it drills down to the peer level so I could see sales by month if I wanted to. I don't right now, so I'm going to keep at the year level. So sales by customer by year. And now I want to break it down by product. So I just find product, let's say description drag to my report and there it is by customer by product. I say sales in three years. It's that easy. If you know how to drag and drop, you can do it. Maybe my exercise, I only want to see one year or maybe two years so I can tell show my fiscal year as a filter for my report. And now the filter is on the right. I only want to see 2020 and that's it. Sales by customer by product in the year 2020. All right, this first part of my report or my dashboard is ready. I'm going to build a new page. I'm going to click like in Excel, a new tab. And on this tab I want to see sales and gross profit trend over time. I'm going to go quickly just to get the hang of it. I'm double click sales, total sales in the whole company history. I want to double click document dates so it shows me years in my report. And I want to see not by year, I want to see by month. So show sales trend by month in my whole company history. And there it is. And I want to compare with the gross profit percentage. So I'm going to add the gross profit percentage to my rows and right there is my gross profit percentage. And somehow something happened right here anyhow and this is my sales and actually want to put this in what is called a dual axis visualization instead. So my sales are my bars and my gross profit is my blue line. That's it. In a few clicks I see trend analysis of my sales and gross profit. All right, the last example I'm going to click create one more sheet another like another like tab in Excel. In this one I want to use geographic information could be shipped to could be customer address. I'm going to pick state and I want to see sales by state and put this on a map. And on a map it is where the size of the bubbles are the size of my sales and then I can see how I'm doing by region. So three reports and now I want to put these reports into a dashboard. Remember that I told you in Acumatica you use two different tools to build a report or to build a dashboard. Indita self is the same report designer. I create those three different separate reports. Going to drag and drop the first one which is a tableau report on the left I'm going to put my tabular analysis, my trend analysis at the Bottom, you want to put the map on the far top right and in a few clicks I built this dashboard from scratch and now if I save it, if I click the save button I can save it, put a name, and now it's available for everyone that have access to that particular data repository. So this could be a sales dashboard for my salespeople when they save it, they have access. And let's say that I'm the business analyst, I save this dashboard to the VP of sales and I call him or her, check it out, the VP of sales open this report in their tablet and let's say they want to see how they're doing on the west of the country. They can use their finger on a tablet to select the rest of the country. And when they do that, it changes the whole dashboard to only show data whatever they have selected. And that's the power of Data Self. It takes little time to build complex dashboards that will take much longer in Acumatica and they are highly interactive. Now some of you, if you are more the consultant, the it, the business analyst that are used to go Techumatica, build gis, export gis to Excel and blah blah blah, how do you do that? In Data Self is similar framework you go to Acumatica there are dedicated Data Self gis out of the box to make the initial deployment take 15 minutes. So super easy. And they are just GIS. As you can tell this DSA as data self analytics sales GI has AR trend B account, inventory item and these are the fields we're pulling out of the box. If you edit this GI you add more fields, you link more tables. Whatever you do in the GI that data will flow automatically into Data Self. And when you go to this report editor, whatever you did in that GI will be coming and be populating this list. If you had a user defined field, it pops here and when it pops you just drag and drop in the reports. At the end of the day that's how the back end works. So I finished the product presentation, I hope you have enjoyed but I have some more interesting things to show. So I'm going to go back to my PowerPoint to show a few extra slides. First of all, how much it costs Advanced analytics, which is what I showed you so far starts at $299 per month. If you order directly from Data Self and is a month to month contract you can also order directly from Acumatica is the same price and you paid yearly and you can pay along with your Acumatica year subscription. So absolutely you can do that right now because you're putting your time to learn more about Data Self we are offering a 14 day free trial. So if you want to give it a shot without paying any money, yes you can. And I'm going to show you now how you can do it. How to deploy Data Self analytics right now for free. I'm not going to do it, I'm just going to show you. But it takes about 15 minutes, 1 5, 15 minutes to deploy data Self for acumatic. I'm going to show what you need to do to do that. I'm going to go back to my browser, go to dataself.com when you get to our website, click the Acumatica logo right here on the homepage. I'm going to click on it when you go to the next page. We have Advanced analytics which I showed you today and Enterprise analytics. We have also a more capable, powerful tool for bigger organizations with more complex needs. Absolutely, we can do way more than I show you today. But that's not the presentation that I'm showing today. So I'm going to keep on the Advanced analytics. I'm going to click this button. This page here has good explanation about what advanced analytics is about. Some videos Information business information pricing. You know how the pricing works in case, in case you go through the 14 day and you need to. You know you want to keep it. You know how the pricing works. So feel free to explore the pricing. There's more information system architecture. There's also some screenshots of what you get out of Data Self. But let's assume you are sold and you want to see your data in dataself Today what you do is you click Deploy analytics now again is a 14 day trial. There is this link here that you can learn about the deployment process and pretty much what you'll need to finish the deployment. That will take about 15 minutes is contact information including your reseller. We need to know who your reseller is. Second, you will have to create a user for Data Self in your acumatica system. And the deployment form has instructions of how to create a user in case you don't know in what user rights you need to give to this user. And the final technical step is to upload the default Data Self GIS or generic inquiries to your acumatica. We also have instructions, it's fairly straightforward and it does not affect your acumatica. Then the last step of Data Self deployment form is selecting how many users, what templates you want, what are templates? You know we have core financials templates, we have distribution templates, manufacturing in construction and whatnot. So you define your templates and you press, you put the credit card information which will not be charged for 14 days, you press deploy and in a few hours, depending how big your database is, in a few hours you get an email from us telling welcome your data is in Data Self. Here are your credentials for you to log in and see Data Self out of the box. Everything that I showed you so far in the demo is available out of the box. So if you go and do this, you can do this with your Data self and the out of the box will not be inside of your acumatica by default. So you have this segment here externally to Acumatica, but we do provide you instructions on how you can embed Data Self in Acumatica. It takes about five minutes to do that procedure and embed data self dashboards and reports inside of acumatica. But that's the procedure. Go again to dataself.com click akumatica logo, click Advanced analytics, go over this page, learn it, call us, click Deploy now. It takes about 15 minutes. Once you deploy it, in a few hours that it is loaded to Data Self and then you can give it a shot. It's that easy already. With that I conclude my one way talk. I'm going to open questions and answers. So if you have questions you can use the Zoom chatting box. I think is the QA or the where is here. There is also a section here that allows you. Oh it's the chat box. There's also a chat box on the Zoom interface that allows you to enter questions. So please feel free to ask questions and I'll be addressing them. So let me see if we have any questions here. Let me open the other screen here where we have the chat the questions. Okay, yes, there are questions here. Let me just move it over over here. Question from Margaret. Can Data Self connect with an on premises point of sale system? Margaret, thanks for your question. Yes, we can connect to any data source, Point of sale system, payroll systems, Google Analytics, HubSpot, Salesforce.com, any data source you have, any data silo we can connect to quite often when you need other data sources beyond Qematica, you need to go to Data Self Enterprise. Data Self Enterprise can consolidate different data sources. What I showed you today for 299per month is only for acumatica. But yes, we can bring on premise point of sale to Data Self and it's kind of similar to what we did Today. Margaret, thanks for your question. Let's see other questions. Question from Carl what is the training involved in Data Self? Carl, thanks for your question. What is the training involved with Data Self? So there are three levels of training with Data Self four levels of training Data Self. We have some clients that they watch this webinar, they deploy the solution and they just run with it. We have a lot of training materials, videos on our website and some other sites that provide a lot of self service training. So you do not need to pay a person to teach you. No you don't. If you are self talking a person you might be able to do it without zero support from Data Self. That's option number one. For those who are self taught we have some clients that they actually require some assistance with a deployment, especially with data quality. You know when we pull the data out of your system, sometimes the data might not match with the way that you have your ecumedica set up your akumatica system report. So we have a flat fee to go over Data Self and to show you the GIS in Data Self how they work and how you can fix the gis, GIS or generic inquiries to match with your own GIS to be sure Data Self matches with your own reports in acumatica. So that's usually a very small effort from our team to just align your how Data Self work versus how you know Ecumenica works and quickly get you going. Usually $500 or something like that. We can get to that level. We have the third level of services which is people need training, guidance. So we have what we call the orange Belt certification training. It's an eight hour course that people who go to this eight hour course will be amazingly empowered to build reports and dashboards and do a lot of the things that I show you today and beyond by themselves without calling for us. So that would be the orange Belt certification training. That is the level three. Level four of support or training is some clients, they are very sophisticated, they have a lot of needs, they need a lot of data sources. And for those more sophisticated clients we do sows, we assess their problems, their challenges and then we will see how we can help them. But that's usually how we go about the different options. Alrighty, thanks for your question. Let me see if we have more answer more questions. We have a question here from Phoenix. The question is kind of broke Phoenix. I'm sorry but somehow I only got the first three words of your question so if you could retype it I will get back to you. Let's see if I have more questions. I think those are the only questions I'm seeing. We'll just give a few seconds for Phoenix. Phoenix, if you type your question I'll finish. In the meantime, let me just go to the next slide. For those of you who want to contact us to discuss to learn more about it, here is my email address in our phone number. Feel free to contact us anytime to discuss your needs to see if we can help you. Let me see if Phoenix asked Fish Initiative question he has not. So folks, I really appreciate your time today. I hope again you stay safe, well and sane. If you have any questions give us a call if you deploy it. Most likely by the end of the day today you might have data self with your data so I hope you take advantage of the opportunity. Thank you for your for your time. By the way this is being recorded in the next day. Probably we're going to be emailing you a copy of this recorded and if you want to share with other people, absolutely feel free. Thank you very much and Happy Friday.










