Advanced Analytics by DataSelf - Natural Language and Ad Hoc - Intro Part 1

Johnny Girardi walks through DataSelf analytics: start with prebuilt Sales dashboards, use natural-language queries like "sales by salesperson in 2019" to generate instant reports, or build custom reports from scratch. Filter by year, sort to find your fastest-growing customers, and everything syncs across the dashboard.
Questions this video answers
Johnny Girardi (DataSelf AI).
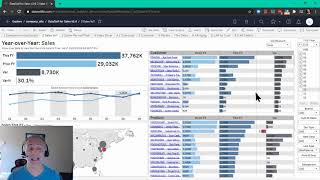
Sales dashboard → choose number two: "Sales year over year".
"sales by salesperson in 2019".

Chapters
Hi there, my name is Johnny Girardi and I'm going to cover three different topics in this quick introduction video of Data Self analytics. First, how to get value right off the bat. Second, natural language query and third, how to build new reports from scratch using the report editor. So first topic, when you log to Data Self portal you're likely going to get into the home page from the home page to get some value. Click the Explore link on the left. On the next page click this dropdown and choose all workbooks. Workbooks have pre configured reports and dashboards that have proven to be valuable to other organizations. My recommendation is click first on the Data cell for sales dashboard or workbook and then here choose the number two Sales year over year. It's a very popular report or dashboard to get started. Here you'll see your sales this year and you define this year with this dropdown. Any year you can select how you're doing versus the prior year in the change. And if you want to see let's say year to date, you know right now we're looking the whole year. Hey, let's only look through period nine, you know, first period through period nine on a year to day basis press the apply button. It will change the whole dashboard to only show year to date information. So right now I can see that on a yearly basis I'm growing about 30%. And this is the trend analysis. Sales by region by customer. Last year, this year in the variance the same by product. Now this is highly interactive. What if I want to see my top customers by sales growth? You know the hot customers. Well, I can easily sort these tables by going to the header and clicking on the sort icon. I'm going to click once here and what it does is sorts in a descending order. Meaning these customers are growing the most since last year to date. Maybe you want to see who has declined the most since last year to date. I can go again and click the sort again and we'll sort in an ascending order meaning these or the clients declined the most since last year to date. Interesting insight. What if I want to focus in only a few of them? I can use the mouse to select some customers. I'm going to select the top three by sales decline. And now the whole dashboard is filtered only for those three and it shows me how much I'm dropping sales total for those three customers. The trend analysis by region in the products are driving the decline. What if I want to see what products are driving the most the decline? I can do the same sorting on the bottom I'm going to go to the variance. Click once some products are actually growing. Click again and it shows the products declined the most since last year. Super easy to slice and dice it. Feel free to explore other tabs. If you want to explore the other workbooks, you can click back on the explore here in the top left. You will get back to your workbooks. But now I'm going to be showing natural language query. So click on the search box for NL as in natural language and it's going to show one data source. Click the data source that has the NL as a natural language. This will come into a framework where it will allow you to come up with questions and will give you reports as an answer similar to how searching on the Internet. Let me show it. I'm going to type in the box sales by salesperson in 2019. I wait the tool give me options like hits on the Internet. I choose what I want to see, I click it and we'll build an instant accurate report with the answer to that question. Buy salesperson sales in a descending order in 2019. And yes, all of these reports and dashboards can also be seen using mobile devices. So these are the dashboards that were shown before. Don't forget to watch the next video where I show how to build new reports from scratch. Thanks for watching.