Advanced Analytics by DataSelf - Report Editor, Exporting and Sharing - Intro Part 2
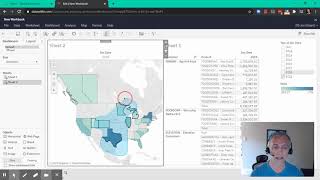
Johnny Girardi walks through building reports in DataSelf: create crosstabs with drill-downs, add filters and map visualizations, assemble dashboards with interactive filtering, and export to Excel, PDF, or email on a schedule.
Chapters
Hi there. This is Johnny Girardi again. And now we're going to show you how to create a new dashboard from scratch. So back to your home page. In dataself, click the Create workbook, which is creating a new workbook, a new report or dashboard. Then you select which data source you want to work with. In our exercise, we're going to use the essay sale. So click Sail Sail and then choose the connect button. This will be the report editor. Here is the essay sales data source with the dimensions and measures. Let me just get some more real estate here. And my first report is going to show sales by customer by year and then I want to break down by period by product. So what I have to do is I'm going to take customer, put in my rows. So these are my customers. I'm going to find sales under measures and drag it and drop into this black box around the ABC area. So drag and drop over there. And now this is total sales by customer in the whole company history. Well, let's see the top customers I can sort. Just click the sort button. And these are the top customer by sales in the whole company history. Well, I want to break it down by year. So I take the document date and I can just drag and drop into my columns. Drag and drop over there. So right now I can see sales by customer in the whole company history, whatever your history is in data self. By the way, if you click the plus here you can drill down to quarters. If you click into the quarters you can go to months and all the way down to the day level. I'm going to collapse back to the year level. And now I only want to see, let's say the past two years. I'm going to filter this. How can I filter? I can go to any of these pills. Click this, drop this arrow down and choose show filter. This will make my year a filter on the right. In my example I'm going to uncheck everything but the last two years. There it is. Sales by customer in the last two years in my sample database. Finally I want to break down by product or anything else. I can scroll on this list, find my next item is going to be product. And I can put before my customer right here will be before or after. When they drag and drop the report will filter and show by customer by product sales for the last two years. Super easy. And if I want to bring by product by customer I can just drag customer on the right of product and then it reverses the order of my report. I'm going to click the back button to undo. My last thing is I want to put subtotals. So I'm going to click on this summary icon and say add all subtotals. And there it is. Super easy. Drag and drop point and click. The first report is created. I'm going to create a second report. So worksheet. I'm going to say a new worksheet. In this example I want to see on a map. So I'm going to choose my geolocation. I'm going to click this icon to expand it and choose state. I'm going to go to my measures and press and hold the control button and select a measure. So I have selected state and sales and now I go to the show me button. Here I click it and I choose this kind of mapping capability and I click the show me button again to hide it right there I can see sales by state using the Coral legend. It's pretty cool. Now this for the whole company history. What if I want to see how it's changing over time? Same like before, I can find my document date on the list. I can put right before my columns, before the longitude. When I drag and drop it will put a map for every year in my database. And now I see how things are changing over time. It's awesome, isn't it? Finally I want to combine these two reports into a dashboard. So I'm going to click dashboard. Now let's say new dashboard. When you create new dashboards, I highly encourage come to size, fixed size and choose automatic because it will make the report automatically fit whatever the size of your screen. So click that automatically. Click it out just to close that little pop up. And now I'm going to drag the first report anywhere. Just drag and drop the first one. You just drag and drop anywhere it brings the first report. Take the second one and when you try to drag, then you can have these quadrants. You can choose where to drag and drop the second report. I want to drag and drop on the right, so my map is going to be on the right, the other is going to be on the left. And by the way, if you didn't like it, you can just take this area and drag it maybe to the left. And now I reverse the order. Now interesting. Here is this report here has all the history and this one only has for the two years. Because the filter only applies to this section. I want this filter to apply to the whole dashboard. Well, I just click on it to highlight the filter. I click the arrow down. Apply to worksheets and choose all using this data source. And by choosing this option, what happens is this filter now will control anything that is in this dashboard. So two years for the map, two years for the grid. And if I only want to see one year, I check here, uncheck what happens is now the map is only 2019 and the report is only 2019. The other filter that is pretty cool is click on any of these quadrants. So you have this highlight around this box and choose this icon which is used as filter. So I'm going to click on it. Now this section can filter the rest of the dashboard and I can go into this button here and choose the lasso. And now with the lasso I can select whatever that I want. And when I select things, look what happens on the right. It filters the grid on the right. Super powerful. Now I built it, it was quick, it was easy, it was amazing. How can I share it with other people? Super easy. You go to file, click Save as you have folders to organize where your dashboard is or your dashboards are. Since this is a sales dashboard, click the sales, put a name my first dashboard and click save. And now every person in your organization that will have rights to access the dashboard, you can now close here. And if you go back to explore and you look at all of your workbooks, there's my first dashboard right here. Or if you go back to projects, projects are a way to organize your reports into different sections and tight security around it. So like in this example, I can make the sales project only for salespeople. When they log data self, they go straight into sales. They can't see anything else. So when they log in, they only see whatever you saved. And when they click on that particular workbook or dashboards, what they get is what you just built. And here they'll have also the ability to do ad hoc analysis. So if they're over here, they want to see a few states. Whatever it is, when they select, it changes the whole report and dashboard. The last thing I want to show is how easy it is to export something to Excel. So let's say that I want to export this crosstab into Excel. I can click on it anywhere. So I enable that section of the dashboard. I click the download button, I can download it as an image data crosstab PDF. In this example I see a crosstab, which is an Excel sheet that has pretty much the information on the section that I highlighted. So now the Excel is right here. I'm going to launch it into the other monitor and just going to make this bigger. There it is the report now is in excel you can do whatever you want. The last thing actually that I'm going to show you is what if I want to receive this dashboard every day every week every month automatically in my email so I don't have to go to it. Sure I click the subscribe button and I can decide who's going to be receiving this email. I can add anyone that is licensing data self including myself I can tell to only send this view or all the views of this workbook I can define how I'm going to email it only PDF or both of them I scroll down I define a schedule daily, weekly whatnot once I click subscribe that's it hands off every in this case every Tuesday 9am Pacific I get an email with the latest report with the latest information. Super cool super fast super empowering. I hope you found this video informative. Thank you for watching.










