Advanced Analytics by DataSelf with Natural Language and AI (Tableau)
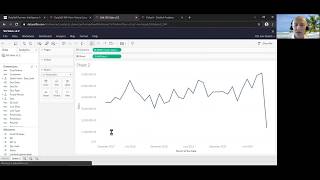
Johnny Girardi shows DataSelf, a Tableau-based analytics tool that lets you query ERP data with natural language. Reports run in seconds, deploy in minutes to an hour, and start at $299/month for 10 users. Supports Acumatica, Sage, and NetSuite.
Questions this video answers
$299 per month for 10 named users.
The first year rate will apply for 20 users (instead of 10).
14-day free trial, limited to the first 10 requests.
Acumatica; Sage 100, Sage 300, Sage X3; NetSuite.
About 15 minutes.
Chapters
Hello everyone. Thanks for joining us. Joining us. My name is Johnny Girardi. I'm data sales founder CEO. I hope you're staying safe and well and sane. My main problem right now is keeping sane, so I'm fortunate that that's my problem. It's trying to keep my brain sane. So many people out there having major problems. So I'm very thankful for my situation. Nevertheless, we have half an hour to cover today, Natural language, artificial intelligence as well as advanced analytics by data self. So let me jump right into this presentation and talk about the benefits of all this technology that we're just launching. For many ERP systems. First is really interactive, allow decision makers to slice and dice their data anytime, anywhere. Super easy to customize for both end users can do a lot of customization themselves as well as people, you know, consultants, business analysts that go through more training. It's way easier to customize reports and dashboards using the data cell framework comparing to the alternative reports and dashboard functionality that comes built into traditional ERP and CRM systems. Our reports run in seconds no matter how much data you have. You know, recently we got a client telling hey, we have a lot of data. How many records? About 2 million. Well, we used to work with way more than that. So in still our reports run in seconds and we do not slow down your ERP and your systems because of our framework. So really fast. And finally deployment is usually done in minutes, maybe in a couple of hours fast to get it itself up and running. So let's jump right into the product to see natural language, how to customize reports and dashboards in how the out of the box solution comes in, the value of the, the canned or the out of the box key performance indicators. So I'm going to switch now to my web portal where I have data self and the first feature I'm going to show is focused on decision makers. So I'm going to show features designed around decision makers. I'm going to show features around, you know, around business analysts, consultants, IT people, people in the accounting and then the framework overall in how to deploy. So let's start with decision makers. These are the people who are usually asking for custom reports, slice and dice their data and usually they have to ask someone else to do the job. So they have to wait and sometimes some questions they cannot wait and they'll have to wing it. Nowadays many companies are nurturing a data driven culture. So natural language is what I'm going to show right now is providing decision makers with a way to find answers to Their questions without learning complicated reporting tools. It's just like searching the Internet. But the source of the data is not the Internet, but is your systems. You know, your ERP system you know, can be acumatica, can be sage, can be netsuite, doesn't matter. Is your system where you pull the data from. Let me show an example. Right now I'm in the natural language framework for sales analysis. So this is the part where I can do extensive analysis of my sales. And suppose I'm the VP of sales and I want to see sales by salesperson in 2019. What I do is sales by salesperson in 2019. So I just type the question like I would do in Google or Bing. Press enter in a new instant accurate report is created from scratch using natural language in artificial intelligence. And that simple. Just like searching on the Internet by salesperson I see sales and right now is looking invoice date in 2019. Super simple. And this natural language allows you to keep on exploring. Hey, I want to break this down by month. Sure, by month, press enter. Now the tool will translate that into a new query. In this example in 2019 by month it put a line chart for each salesperson. That easy. Now many people prefer to see numbers in a different format, different chart. Maybe as a tabular report. I can come over here and choose the representation manually. Hey, I want to see a text table, right? Just like Excel, press it and right there I see the numbers by the penny and hey, maybe I want to get this data into Excel. Very popular way to get data into Excel. You can just pick data points. I'm going to choose the whole month of January, all the data points. So I select them and I tell the tool to show me the data. You know view data is show me the data behind this aggregation. When I click, I go to this view data framework that allows me to see the full data meaning every single line detail. In this case sales. So I'm looking invoice number, invoice date, customer product, quantity, shipped, anything I download now into Excel it becomes an Excel file and then Excel I want to do whatever I want. Super easy for decision makers to find their data slice and dice within data self. And if they want to export to Excel a few clicks away. So this is one example of natural language. Let me clear the sheet, show two more simple examples. Hey, I want to see my top 10 customers by sales in April 2019. It's a more elaborate question and I did not press enter yet. Why? I just want to show that just like when you're searching the Internet and you enter something. The tool give you options of trying to understand your question and tell you which option do you want to choose. If I would choose this one would be Only my top 10 customer by sales in the whole company history. This example is the first option which I just press enter. It will go for the first option which is invoice date in 2019. So I'm going to press enter, which is the first option and the tool will create an instant accurate report entering my question. So here I'm looking sales customers with sales in April 2019 in a descending order. And then in is part of my top 10 out which is the gray color is beyond my top 10. So the tool thought that I want to see all of them and just separate them by color. Maybe I love it, maybe I don't. And it's easy. Hey, what if I want to see this as a text table Again when I choose text table, this example, the artificial intelligence realizes, well, I just want to see my top 10. And here they are with the numbers. Last example of natural language. I'm going to say gross profit by state by year as a map. And what do you get? You get gross profit by state using the color legend which shows the profitability for the two years in my sample database. I need to put the mouse over each state. I can see the details of that particular state. Like Louisiana in 2018, $11.7 million in sales this year is lighter blue, 7 million gross profit in 2019. So decline. And I can see by the color. Anyhow, natural language is a super powerful functionality. Again, similar to searching. The Internet is designed for business people who do not have time to learn how to build reports using traditional reporting tools. Very empowering. And you can do this over the web on mobile devices. So again, if the business person is in a meeting, as long as they have Internet access, they can find answer to the questions anytime, anywhere. It's amazing. Now, just like searching on the Internet, you're not going to find all the answers to all the questions. Absolutely not. Many reports and dashboards will require the consultants, the business analysts, the people who go through more training to heavily customize data self. And now that's what I'm going to show now, how easy it is to customize the solution beyond natural language. So let me get this out of the way. Now I'm going to go into the report edit mode. So right now, those of you who are not consultants, technical business analysts might find this a little bit overwhelming, but it's going to Take me about five minutes to show the basics and you'll see that even the basics is easy. There are many company owners, CEOs, CFOs, salespeople that are not technical from a computer standpoint. And they use data self and they build reports from scratch, just like I'm showing right now. So keep in mind the basics are easy, even, you know, creating reports from scratch. So in the next few minutes, I'm going to build a new dashboard from scratch using the report editor, having three different data sets or three different views. One is I want to see sales by customer, by year, by product. In this year, I want to see sales and profitability trends over time. And I want to see sales by territory. I want to see these three different views, put them together in a dashboard that is highly interactive. Let's do it. So in this report designer on the left, I have the data panel that is connected to the ERP system. Could be any ERP system, but right now it's pulling my dimensions. You know, my customer, my products, my invoices, everything that is we call dimensions. And also my measures measure the numbers. I want to keep track of my sales, cost of sales, gross profit, quantity, sold, return, you name it. So my first report is I want to see sales by customer, by product this year. So let's build it. I want to see customer. Here it is. I drag to my rows, so these are all my customers. I want to see sales I drag and drop into my report. So this is sales by customer in the whole company history. Well, I want to see this year. I can bring my fiscal period to my columns and it shows by year. And I don't want to see all the years. I only want to see this year or some years. So I can say make this a filter. So show me filter right there. I have my filter for all the company history and I don't want to see anything but the current year. There it is. Finally. I also want to break down by product. So I find the product in the list, Product id, drag and drop. There it is. By customer, by product sales this year. It's that easy. If you know how to drag and drop, you can build a lot of reports easily in here if you flip the order. Now I have by product, by customer this year. Simple. All right, that's report number one. Let's make report number two, which is a chart. I want to see trend analysis, sales and gross profit by month in my whole company history. So I'm going to double click sales. This is my total sales in the whole company history. I'm going to double click invoice date. So right now we're showing sales by year and I want to see this on a monthly basis. So I say show me on a monthly basis right now for my whole company history. I see my sales. How is it going to. That was easy. I also want to see gross profit percentage. So I take gross profit percentage, I drag into my report and there it is. I have gross profit percentage and sales. And finally, I want to see this on what is called a dual axis approach. So I chose dual axis approach. Sales order bars in orange and gross profit is aligned in blue. And I can see in a certain month here in December 2018, I got this major drop in profitability. I could be interested to go into that regard. But anyhow, easy to see the trend analysis. All right, that was the report number two, last report. What I want to see is geography, information. I want to see state and sales. I want to see how my sales is going by state. And I tell the tool, show me this showing bubbles as part of my sales. And there it is. By state I see sales. Bigger bubbles, bigger sales. So I just created these three reports from scratch in a few minutes and now I want to put them together in an interactive dashboard. So now I'm going to click a new dashboard and I'm going to say that this dashboard should have a automatic size so it fits whatever the screen size is going to fit inside of my screen. And I want to bring those three reports I created the sheet one, the sheet two, the bottom, and the sheet three, which is the map on the top. Right. And that's it. In a few minutes from scratch, I created this dashboard that is highly interactive. If I go now and click on save, that's it. It's a new report that I could share with my sales team. And let's say if I were to be analyzing my data and I could be looking on a tablet, for instance, hey, how I'm doing on the east coast? I could be selecting the east coast using my finger. If it's a mobile device and when I select it, it changes the whole dashboard to only show me how I'm doing in those particular states. So super simple and super easy and highly interactive to build some things from scratch, save it, share with others, and start to analyze your trend analysis. I'm showing a sales example, but this applies to any data set. It could be receivables, payables, financials, inventory, purchasing services, CRM. No matter what your data is, once your data is in data self. Decision makers can use natural language to query in data self or business analysts, consultants, people who go through more training they can learn how to use this report in dashboard editor to extensively customize the solution. So what I just showed you is customization, either ad hoc or customization from scratch. What I'm going to show you next is the out of the box solution in some of the dashboards that we have that are very powerful. I'm going to go back to my pre configured dashboard natural language that I was using. Now I'm going to click on the year over year sales dashboard. This dashboard is available out of the box in most of our clients that are sales driven organizations. They find in this out of the box dashboard SAS or with little customizations extremely valuable because most businesses are usually looking at their sales what's happened this year and usually comparing versus prior year. Are we doing better? Are we doing less? Why and who and what and where? What are the problems? Where are the opportunities? So let me show a little bit how this dashboard works. So right now I'm looking at, let me actually say here, start from scratch. Right now what I'm looking this dashboard is sales this year, sales last year and right now I'm declining by 14%. When I look at my sales by period, I see that last year, which is the light blue is a full year while the dark blue this year it goes through October. Right now in my simple database today is October 8, 2019. So I'm comparing a full last year versus this year is not fair. Of course I'm declining. What if I'm going to compare certain periods? Maybe only a few months, maybe some quarters, maybe year to date. You just go to the filter on the right and you select the period you want to focus on. So in this example I'm going to uncheck the periods 10 through 11 to 12 because I want to only see year to date. I press apply. Now my comparison is last year and this year to date through the end of period nine. When I look on a year to date basis that perspective I'm growing about 11%. So great news. I can see how I'm doing from a geography standpoint. Geography could be shipped to or it could be customer address, anything. You have an address in your database we can easily plot on maps. And then the bubbles in this example is sales this fiscal year. Black bubbles I'm growing since last year to date in this example, red bubbles I'm declining. Like in this example, L.A. i'm declining by 16% as I can see on the pop up taxes, I'm growing 38% since last year, doing really well in Texas. I can see my customers sales last year to date, this year to date in the variance and right now this report is sorted in a descending order by the variance. So I'm seeing the biggest sales decline since last year to date. How about that? What if I want to see growth? I can come over here on any of these columns. Maybe I want to see my top customers by sales this year. I can sort this column by clicking on the sort icon. So these customers are growing the most. I'm sorry. These customers are the biggest customer by sales this year. Now I'm sorting this column. So these customers were the biggest last year. And again if I want to see the top decline, I click once. These customers are growing the most since last year. I click again. These are declining the most. What about them? I don't know. Let me check these two customers by top sales decline. When I select those two customers, the whole dashboard changes to show only those two customers. So $3 million in last sales, 32% total last year. Significantly bigger than this year shipped to information in products. What products are driving the decline? I can sort the bottom and see these products are driving the biggest decline for those two customers. Very interactive. Giving users the ability to slice and dice their data like this is super powerful. End users can take it off. You know, they can take this and say hey, I I would like to receive this report in my inbox every day, every week, every month, whatever the schedule is. How can they do it? They just click the subscribe button. They can do it themselves or you can do it as the admin person and then you tell who's going to be receiving this report. So you can put people's names, all the team I can put myself. I can email only this report or the whole workbook and I can tell how often I'm going to receive this report. Every day, every Friday, days of the week, monthly and whatnot. Once I click subscribe, that's it. Report distribution is completely automated. I'll receive this report. All the people that I configured will receive this report on schedule. Hands free, easy to interact, easy to distribute information. All right, so I hope you found this little overview informative. Let me go back to my PowerPoint to give you some extra information about data Self. What about pricing? This solution we sell on a monthly subscription or leader subscription and it starts at $299 per month for 10 named users. So we make it inexpensive for because you are attending today's webinar, we'll give you a promotion that the first year that you're signing up, this rate will be for 20 users. And hopefully especially because of this whole madness going out there with the virus, hopefully these actual users will help you until you get back to normal. And then if you don't need additional users, you can eventually decommission beside, you know, without paying them. So if you want to take advantage of this opportunity, you get an order through Friday next week and you can email salesataself.com or contact your reseller to talk about it, discuss it and hopefully move forward. But there is more. Because of this webinar, we're also doing a one time offer. You can actually try Data Self for no charge for 14 days and this is limited to the first 10 requests. So if you're interested in a 14 day trial, contact your reseller, contact us quickly so we can get that going. Now what if you want to learn more about Data Self as you're trying to investigate if it's going to work for you or not. So let me go back to my website. I haven't got my website yet, so let me go back to dataself.com so visit our website and all of these products we support. What I showed you today is only available for Acumatica for Sage 100, Sage 300 in Sage X3, well as NetSuite. If you have one of these five products, you know Acumatica, Sage 100, 300 X3 or NetSuite. Everything that I showed you today would be available. If you want to learn more about what I covered, you can click on the product like Acumatic. I'm going to click Sage because it has an extra step. I'm going to click Sage. Then you go to the next step. Then you pick either 100, 300 x 3. And when you click on your product, you come to this page. This page is the same across all products. You have the European name and Analytics. Then you have these two buttons. Advanced analytics and Enterprise. What I showed you today is called Advanced analytics where the price is very inexpensive. We also have an enterprise analytics that has a lot more power. It can bring multi companies, multi currency. You can bring Google Analytics, data, payroll, anything. But most of our clients start with us with Advanced analytics because it's simple, inexpensive, it's fast and you can justify the investment. So click the Advanced analytics button. So you go to this page that gives more explanation, including some videos, including some customer testimonials, some descriptions. If you See the Deploy analytics now button where Acumatica is working really well and you can actually deploy for acumatica in about 15 minutes. Super fast. For the other systems it takes a little longer, but it's like an hour or so. So simple you can scroll down further to see pricing. So here you'll see exactly how the pricing of Advanced analytics works by user, by different editions, what's coming out of the system. So please feel free to explore pricing more information architecture. You go to the bottom you have this sales and AR agent templates. If you click this link you go to another page that shows screenshots what's available out of the box. So this is a subset of the whole out of the box, but feel free to explore it and most importantly, please contact us to learn, to discuss to see if this applies to your business how we can help you. We absolutely want to first educate you about the options and how it works. But right now we're trying to make it something that does not cost you money until you see the value. And again this is limited to the first 10 requests. Right now I'm going to open a quick question and answers. We have three minutes to go. So I'm going to see if anyone already post some questions and if you have not you can go to the Zoom panel, the Q and A or the chat box and ask a question and I see here a question. Is there going to be an option to subscribe known Data Self users to receive reports? We currently have many sales managers who use Data Self but want to be able to automatically send reports out to their sales agents. The answer is yet and whoever sent you this message please email us either sales or or support or any of your Data Self people and we'll talk how you can subscribe users that are not Data Self users Absolutely as possible. Thank you for your question. Let me see if I have another question. Another question just popped. Are there any special setups that need to be done prior to use? Do we need to have special templates for our information? Good question. If you have an Acumatica ERP system the requirements are super simple. You create a users for Data self, upload some generic inquiries to your acumatica and fill out our deployment form and pretty much in a few hours the system comes alive. If you have an on prem system like Sage, then we have to schedule a time to install a small footprint application on your network. That's typically done in about an hour. If you want to learn more please email us and we can give information. What are the system requirements. Usually all servers hosting something like Sage can host our application because it has very little demand. One more question before we stop. Keep on sending the question because we're going to be answering them anyway later by email. Does this support multiple companies in multiple warehouses on each? Great question. The answer is kind of what I showed you today is what we call advanced analytics and we also talked about a little bit about the enterprise analytics advanced analytics. One of the features is it can only work with one company database. If you have multi companies then every company would have to have its own advanced analytics site even though the first one is 29 per month. Additionals is more affordable. If you want to bring all of these companies together in a single Data Self system then we have Data Self Enterprise that allows multi company to work across the board. We are running out of time and we have more questions but we'll be answering them on a 1:1 basis. Please can take a screenshot of this page where you have my contact information. If you want to learn more about Data Self, we're here to help. Contact your reseller and I hope you enjoy the session. By the way it's being recorded. It will be sharing this recording with all of you and you can feel free to share with others. Thank you for joining us. Stay well.










