Analytics and BI for Sage ERP X3
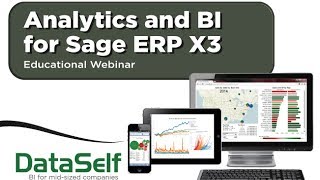
Gianni Girardi, founder of DataSelf AI, walks through analytics for Sage ERP X3. The platform combines Tableau, SQL Server, and DataSelf's ETL to deliver role-based dashboards with KPIs for sales, supply chain, and financials. The demo shows drag-and-drop editing and exception reporting.
Chapters
Good morning everyone. Happy Thursday. Hope you're having a great day. Thanks for joining us. Analytics and BI for Sage ERP X3 My name is Gianni Girardi. I'm the founder and CEO of DataSelf. Before I jump into the product presentation, I think we're going to have a very informative 30 minute session. I want to give you a brief overview of why I founded Dataself and what the vision behind the company is. So I'm an electrical engineer as my background and in my early career I spent several years programming hard things, hard coding, programming. So I'm very good with computers, with technology tools, tables and so forth. Eventually I fell in love with the business area. I did my mba, I became a business person and I joined the business intelligence industry back in the year 2000. In 2005 I spun off Dataself and the vision was, well, mid sized companies need better reporting, but the great technology is usually from the upper market, the Fortune 2000, and it's usually very expensive and usually complicated for mid sized companies. So my vision when I founded it itself was, well, I think I can make this better. I can actually find in the upper market top notch technology that should fit the needs, the budget and the sophistication of the mid market. And I want to take that technology, I want to make it better, I want to make it simpler and I want to make it better. So take the best technology out there, add my own spin to it, my own technology to make the whole framework simpler and better. We say we simplify and we amplify. So that was back in 2005 when I started the business. We came a long way. The core team of Data Self has been working with this kind of technology in mid sized products for over 14 years. So I think you'll find this session informative. And let's get started. So first of all, all lines are muted. If you have questions, Please use the GoToMeeting Chatting Panel to type in your questions. And at the end we're going to be addressing questions. So I'm going to cover first of all a few PowerPoint slides, talk about why analytics. I'll spend some time talking about the product, showing it and then we're gonna go for a Q and a session. So X3 is a fairly new product in the Sage community and we are rolling out our solution for X3. This is our forecast of rolling out. We should be rolling out our sales module for X3 in the next quarter and then we're going to be covering supply chain in the following quarter and then financials by the end of the year. So this is the way we're rolling it out, how we usually tackle each one of these different topics. Let me talk about sales because the first one and if you have people that may be interested in getting better sales analysis out of x3, then let's see what's coming out in the second quarter of 2014. And this is pretty much based on our experience building for other ERP packages. And we're building also into the X3 solution. So most people, when they're looking for better analytics out of an ERP package like x3, and by the way, x3 is a very sophisticated one. Business people, they want to have usually a better understanding of their sales and profitability initiatives. They want to see customer sales growth and decline change over year. Products, salespeople, territories, shiptos, they just have a better understanding of all of these sales initiatives going on. And they may want to know anytime, anywhere. They may be in a meeting, in a phone call, using a smartphone or a tablet and they want to be able to gather that information whenever they are. So our solution provides several ways to deliver that kind of value. Some companies, they have a more elaborate ordering and invoicing system and it may take time between the two and their inefficiencies. So using our analytics to pinpoint where the inefficiencies are so you can tackle them quickly is important. And we are incorporating also this kind of functionality into the X3 solution. Some companies, they spend ton of hours on an ongoing basis, every week, month or quarter. Calculating sales commissions and quotas is a very time consuming job that people go into Excel and do manipulation. Usually with our technology we can automate the process quite often 100%. So good value to be added on the sales commission if it's too time consuming today for your organization. Forecasting. Sales forecasting is a big topic. You know how you can better have an idea of what you're going to be selling. Should you be looking at your past history for forecasting? Or maybe you want to combine the data with other data sources. Maybe you have salespeople coming up with numbers on an Excel sheet, or maybe information is coming from your clients in different formats. So being able to bring the sales forecast and combine it with your extra information can be critical. And this is part of our sales rollout for next quarter price strategy. Maybe you're selling to, you know, you're getting to large contract large and long term contracts. Let's say you're selling to big boxes like Walmart and Target, you better go into the right price strategy to be a win win situation. So using analytics, it can help you analyze all of the possible components that go into the pricing strategy so you'll be sure to have you know the right pricing when you're negotiating with your clients. Finally, data integration. By the same token that I talked about the forecasting, sometimes when you're analyzing your sales information, you need information that comes from outside of X3. I don't know, a POS system, you may have a proprietary system and you need to combine with X3 to have a complete version of your data. So our solution provides easy ways to do that. So these are the most popular topics we cover when it comes to sales. As I mentioned, we're going to be rolling out several modules and our expectations. By the end of the year we should have our complete solution or at least most of the course already built out of X3. Okay, this slide here kind of circles back to my initial vision when I founded the company. What we're looking at here right now is Gartner. Gartner is one of the most reputable companies making assessment of technology in the upper market. So every year Gartner makes this magic quadrant for BI and analytics and they just released for this year last month. So it's fresh information. And what we have here is the more to the right a company is on this magic quadrant, the better it is for Fortune 2000. You know, Gartner does this analysis of Fortune 2000 mostly. So for mid sized companies, it's not so critical to have a vendor further to the right side. However, the higher the company is on the Y axis, the better the company is executing their vision or delivering their progress products and services. So what we have here, these two highlighted vendors, Tableau and Microsoft. Tableau right now is considered the king of the hill when it comes to dashboarding analytics, data visualization, empowering business people with easy access to their data anytime, anywhere. That's Tableau, the leader right now. They went IPO last year, very successful ipo. Microsoft is considered the leader in the BI infrastructure framework, providing a powerful, reliable, scalable, yet inexpensive framework for data warehousing backend. Well, what about these guys? What about Data Self? It goes back to my initial vision. I wanted to go to the upper market, find the best of the technology, make it simpler, make it better. And that's what we have right now. Data Self analytics is actually, you know, we take Tableau, which is the leader by far in data visualization technology, we take SQL Server which is the platform for the BI infrastructure for Microsoft. We put them in a box, we add our own ETL technology, which stands for extraction, transformation and loading. That simplifies and removes programming from those other two tools. And then we are adding out of the box lots of reports, dashboards and KPIs to make the solution better. So we simplify those two vendors and we amplify it. That's what our magic is. Let me repeat in a different way. So again, why data self analytics? It's top notch technology. Right now there is nothing better out there when it comes to data visualization technology and BI infrastructure. But we make it simpler, we simplify it, we eliminate programming from the equation, then we amplify it. We have not only a great technology, but out of the box there's tons of reports, dashboards and KPIs. Make a long story short, you're getting pretty much the easiest to use technology for business people. Again, anytime, anywhere. They'll be able to access their dashboards and slice and dice them on the fly. It's the easiest available out there, is the easiest for it. So for the IT maintenance also, this platform is outstanding. Fast to deploy. If you'll be building a solution like ours from scratch without using our framework, it will take you months, most likely years, several people to put it together. So for us usually takes a fraction of the time for actually most likely it's going to take days of weeks worth of work to deploy. So much faster, low cost. If you build it yourself, which definitely you can, it's going to cost you easily into the six figures. Our cost is significantly less than that. And finally, expertise. Our team, our core team has been working for over 14 years working with BI technology, this framework here, working with mid size ERP packages. We have worked with over 10 CRM and ERP CRM systems and we know how to connect together for companies in the mid market. So you get expertise as well from us. And again it goes back to my vision. I take the best of the technology out there, I simplify it and amplify it. So that's what our magic source is. And because we use the best of the breed components, we consider our solution like a Ferrari in the mid market. It's the faster, the more sophisticated, the easier to use. However, it does not cost a Ferrari. It actually is more like a Toyota, sometimes even less of that cost. So what we're going to do now is go for a test drive. We're going to cover three different parts. I'm going to talk about security sample KPIs and then AD hoc examples. So let's buckle up, put our helmets and have this baby fire spin. All righty, let's go for it. So most people, most business users will access information using a web portal, using, let's say a desktop, web or mobile device. This portal is highly secured. So first of all, security, highly secured. Second, when they log into the portal, it will only give me my own reports and dashboards. So if I'm a salesperson, I will access the sales team dashboards. If I'm the person from finance, I'll access the finance team reports and dashboards. Now, when they open one of these dashboards, and right now I'm accessing a sales team kind of dashboard, when I open one of them like this one, then another layer of security can kick in. This dashboard would be the same for everyone that is in the sales team. However, I'm the rep for California. I would only be able to see the top customers by sales in California, while the rep for Florida opens the same dashboard and only views the top customers in Florida, while the big boss opens the same dashboard and views the top customers across all territories. So security can also have this kind of granularity. Same dashboard, only one. Everyone sees their own information. So let's take a look at some of these out of the box reports we're building for Axe 3. And also kind of similar to other packages, when we're building the dashboards and the reports, we try to make them informative and insightful. Many dashboards are only number driven. So for people who do not like pictures and charts, they see just numbers. Like accountants, they love numbers. Some people love charts. So we have a blend of both. I'm going to show here the little bit more kind of flashy ones, but also want to show some examples with just numbers. This dashboard is an example of what we call a top performer dashboard. We have tons of top performer dashboards. In this example, I have my customers here. Each customer has a bar. The bigger the bar, the bigger the sales are. And then the color of the bar is represented by its gross profit. So just by looking at my top customers, I can see that this one here is fairly low profitability. Is that a problem? If it is, well, now you know, you better work on it. We also have the profitability in this example, using the black dots in this other axis here. So I can also see the black dots to see profitability. Simple dashboard, very insightful when you look at information like top customers by sales and profitability. Another more Intriguing type of report is when you're looking at the tip of the growth curve of your major key performance indicators. This is an example. Assume you have recurring customers. These customers are the top ones by sales growth since last year to date. Most likely happy customers, salespeople working closely with them. Maybe I don't need to worry about them because everything is working great. How about the top customer by sales decline? Maybe something is wrong with some of them, maybe no one knows about it, and maybe when they figure it's too late. So knowing who is growing the most or who is declining the most from any major key performance indicators can be critical. Like this example, and we have lots of reports out of the box showing that and coming for X3 in the next quarter. All right, let's see another report that is usually also very intriguing and can be critical for most businesses. It's called exception reporting. Exception reporting is looking at trends that are no longer happening. This is an example. So if I have recurring customers, why these customers here are no longer buying? You know, I have here in the last 30 days, no sales, but yes, the last 60. I can easily change these buckets. Let's say I had sales the last half a year, but not in the last 90 days. You name it. But the point is, why is it okay? Maybe yes, maybe not. The point is you have to know them to be proactive if something is going wrong and fix in a timely fashion. And these dashboards, looking at these trends all over the place will help you do that. Look at one more report and I'm going to jump into some ad hoc analysis. Sales by geography. So this dashboard here, it shows sales by state, bigger bubbles, bigger sales. And they are sliced by colors that are the aggregation of the deal size or invoice size. And then I could be viewing this dashboard on a mobile device, let's say an iPad, and change the dates and see if I'm growing or declining and if the slides are growing, declining. So very easy to change, very interactive. I also see here my salespeople with bars for sales profitability with the color in what products are being sold. Now if I'm the VP of sales and I'm meeting with the west coast team, I can take my iPad for instance, and select with my fingers just the west coast states. And when I do that, it changes the dashboard to show salespeople selling to those three states and what products being shipped. Very easy. Just kind of, you know, point and click. Maybe only when I see sales for one salesperson, I click on it. And now the dashboard changes even more to narrow it down, only for that salespeople, very dynamic information. Most business people will be able to do this on the fly by themselves. Most of them, they don't even need training. Usually about an hour is enough to give them enough skill sets to go through and do these things by themselves. Now, if I'm a power user and I want to have extensive ad hoc analysis capabilities, how can I do it? Well, let me show you. If I'm a power user, only power users can do this. They will have this edit button here. They click the edit button and they go into the edit mode. And here they can change everything. But before I show you that, let me give the story of this tool here. This tool, the engine behind this tool was designed by Stanford University professors. They studied how business people look at business data and make sense out of it. It's a journey, it's a process. And that's why when a business person asks an it for a report, the it goes, comes back. And the business person, well, can you change this? Can you change that? And there you go again. When it comes back, can you add a filter? Can you add a summary? Can you put a chart? And sometimes it takes several interactions. It is what it is. It's a journey. So these Stanford University professors, they studied this journey that business people go through, and they come up with a software engine that helps business people walk through the journey with no assistance from it. That's the beauty of it. It's much, much simpler. It's easy, it is intuitive. So let's see how it works. So when I got into the edit mode, I have access to my different queries that were in my original dashboard. Now, if I'm an accountant, a cfo, I don't want to see charts. I want to see a grid. I could take any of my dashboards and choose the grid view instead. Right there I see numbers by the penny. Okay, now I like this approach, but I want to slice and dice it. I want to put sales by salesperson, by product line. Well, I can come to this data panel. I just find what the reporting parameter I'm looking for in this case, product line. And I just drag and drop into my report, let's say my rows. So by salesperson, by product line, sales, gross profit. Very easy, very intuitive. I could do that on my iPad. Maybe I'm going to break down my customer. Well, same idea. You go to the customer, find, let's say customer name, drag into, let's say before salesperson, between the two at the end, just drag and drop where you want and there you go. You'll have by salesperson, by customer, by product line. Maybe you want to see sales by year, by quarter, by month, fiscal period, by week, rolling periods, you name it. Usually you just drag and drop and there you go. You'll have the outcome that you're looking for. Maybe you want to download this information email as a PDF download to Excel. Overall, you put the mouse where you want to export. You click View data. You can have all the underlying data. You can have lots of records, all the details, invoice number, ship to customer number, whatever. Then you can download into Excel, let's say and then do further analysis. The point is easy, it's intuitive and it's designed for business people. We have several CEOs, VP of Sales, CFOs that are using this technology and being able to do things before would require consultants and now these business people are doing it. It's really impressive. Alrighty, so that was our spin on the Ferrari. I hope you had some fun like I did. Let's move forward and get questions. So if you have questions, Please use the GoToMeeting panel, the chatting area and we're going to be addressing them. So let me access the panel. Let's see questions. Yes, we have questions here. First question is from Janet. Thank you Janet. Can this application import data from other data sources? Janet, good question. Actually let me show here the architecture. Absolutely. This is an open framework BI technology. What we are going to be rolling out next quarter is connectors to Sage 300. So out of the box is going to bring the most popular Sage X three tables into a ultralight data warehouse. We also have connectors for many of the data sources. Let's say if you have a sage CRM SalesLogix, many other systems we just plug and play. But also if you have other data sources, proprietary, maybe in Excel, maybe in SQL Access, you name it, we can bring data from pretty much any data source into the ultralight data warehouse. This whole approach is done through code free environment. So it's much easier and simpler than if you'd be using traditional data warehousing technology. Once we combine the data in this data warehouse, then the information flows through the on site or on prem or in the premises analytics component. And at the end of the day business people can access information anytime, anywhere using desktop, web and mobile devices. Janet, good question. Thank you. Let's see more questions here. Oh, interesting question here. Since this seems to be a new product, how are you engaging with with X3 clients. Steve, awesome question. So I think what you're saying here is you're telling that this is a new product Data cell for X3. Sort of. It's not a new product. You know, our technology has been around for a long time, it's a new connector. So we're just working on a subset of the whole solution. But yes, it's a new connector. All the templates we're building for X3 are brand new. So how are we engaging with new clients? So what we're doing is we are working with early adopter interested people. People that look at this and they say awesome, you guys have Tableau and Microsoft PI, best with technology. Tell me about it. How much is it going to cost? Is it going to work for me? So we talk with our adopters to see if what we're building is a good fit for their business needs. If our cost is in budget and if that's the case, if they're interested in moving forward. We often offer a we call early adopter discount. So they're going to help us and be patient as we roll out this technology for them and with the templates. And if there are some issues, it may take a little bit more time to fix, but we're giving them a financial incentive to work with us to make this an outstanding solution. That's how we engage with early adopters. We look for people who are willing to be part of the journey, help us get these templates fine tuned and we usually do customizations for them because they are helping us and they're going to pay usually significantly less than if they would buy the solution after we have already got over the early adopter phase. Awesome and very relevant question. Steve, thank you very much. Let's see more questions here. Another interesting question here from Mike. How do you compare against Sage Intelligence? Mike, that's also a question that people usually ask us. So Sage Intelligence Enterprise, which is the main solution for X3, it's a great BI platform as well. But when we compare with them we call Sage Enterprise more like a Bimmer, a Mercedes, a Porsche. It's awesome solution, is affordable and for we call the bottom of the market, it's great. Now x3 clients usually are more sophisticated, they have bigger budgets and they're looking for the best of the breed. So why would they say that we are Ferrari and in Sage Intelligence it's not. We circle back to this slide here. Sage Intelligence Enterprise is powered by Nectary, which is not even plotted by Gartner. So it's not considered one of the top notch technologies out there. It's awesome technology, don't take me wrong. If it fits your needs, if you have the budget, it's outstanding. As I mentioned, like a Bimmer Mercedes, a Porsche. Awesome solution. But for those clients who are willing to put more money and get the best of the breed to get the Ferrari, we are it. So that's how we compare. I think Data Self is positioned towards the upper market of the X3 while Sage Enterprise is going to work more for the remaining of the folks. Well my friends, it's 10:30 Pacific so I really respect your time. We have a few more questions here but we have to wrap. We'll be addressing them on a 1:1 basis before I just tell you goodbye. If you go to our website, go to analytics by product and choose x3. We are building materials for this page and tomorrow most likely we're going to have a recording of this webinar. So if you want to share with other people you can go to this page and click the webinar recording button. We also have some other supporting documentation that if you want to check. Finally you have here my email, phone, cell phone, Twitter. If you could follow us, follow me. You're going to be releasing news. I really appreciate your time in Eastern our business. I wish you a happy Thursday and looking forward to connect with you in the near future as well. Happy Thursday. Thank you very much for joining us. Goodbye.










