Analytics for Microsoft Dynamics NAV (Navision)
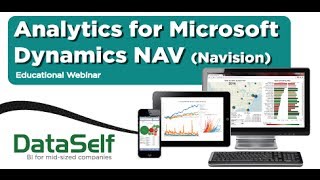
Johnny Giorardi, founder of DataSelf, demonstrates analytics software built for Microsoft Dynamics NAV users. The platform includes 2,000+ pre-built reports and dashboards, runs on Tableau and SQL Server, and typically costs low five figures to deploy in weeks.
Questions this video answers
2005
Tableau (front end) and Microsoft SQL Server (back end), plus DataSelf ETL
More than 2,000
Low five-figure investment (licenses and services)
A few weeks (3–4 weeks is typical); actual installation/configuration can take days of work.
Chapters
Good morning everyone. This is Johnny Giorardi, founder and CEO of Dataself. Happy Thursday. If you are in one of those part of the country which is really cold today, I'm sorry to let you know that here in Northern California we are going to be in the high 60s. It's like summer. Anyhow, thank you very much for joining us. Just before I I jump into the presentation, let me give a brief history of why I founded this company back in 2005 and what we're doing here. So I'm an electrical engineer as background in my early career I spent several years doing coding programming. So I have a very strong programming background. Eventually I fell in love with the business side and I did my MBA and I went into the business area. But I always been in touch with business and technical sides. So in the early 2000 I was invited to join the business intelligence industry. And at that point I was very intrigued by. I'm a fairly technical person programmer. So to me reporting data analysis was something easy. I was familiar with tables, programming, reporting tools, so I had much of a difficulty in that sense. However quickly I realized that the issue is most of the people who are decision makers, they are not necessarily good at programming. I mean usually they're good at doing something else like building businesses, managing people, building products, companies and so forth. And they use the computer just as an aid, something for something more simple, I don't know, emails, browsers, excels and so forth. And these are the people who need data analysis, who need reporting. So often they have to ask someone else when they want something different, some new reporting, some new data analysis and something else is usually no away. It's going to take sometimes hours, days or even weeks to get a reporting together. So quickly I realized that hey, there's a big need to combine technology and make it easier for decision makers. And I thought, hey, I think I can touch this industry and I can make it better. So back in 2005 I founded this business called Dataself. And the main vision is to bring the high end business intelligence and analytics solutions for a price in a framework that fits mid sized companies, budgets and needs. So our goal is make the easiest, the best solution out there, but make it better, make it simple for mid sized companies. So that was how I founded the company back in 2005. We've been working with the same team here, the core team of Dataself, for actually about 13 years total. And what I'm going to show here today is pretty much the latest and greatest technology when it Comes to analytics covering the Microsoft Dynamics Navision market. We cover several other products, Navision GP and so forth. But today we're going to be focusing on Navision. So let's get started. Let me get my computer here. Okay, so we're going to spend about 15 minutes talking about analytics overall, the concepts behind analytics. Then we're going to spend about 20 minutes or so covering how we do it. And then we're going to open a Q and a session at the end of it. So usually when companies come to us looking for analytics out of Dynamics Navision, these are the most popular needs that they're looking for. They want to do better sales analysis out of Navision. They may want to have a better analysis out of their supply chain systems. And also sometimes if they're manufacturers, they want to do a better understanding of their manufacturing processes. So just let's take a quicker look at how we can add value to those different pieces of analysis. The sales is the most popular module that people come to us to get improvement. The most basic needs is companies just want to have a better understanding of their sales processes and the profitability. You know, they want to have a better understanding of sales by anything, by salesperson, by product, product family, territory, account managers, ship to location, any kind of sales, profitability analysis. Analytics can really add a lot of value. And it's very, very common when people come to us looking for those perspectives. Some companies, they have a little bit more elaborate ordering and invoicing processes. You know, sometimes it takes a while between the order and the process and the invoicing per se and shipping, all of those things. So having a better understanding of these processes and how you can manage more efficiently is also a topic that analytics can help you understand what's going on and focus where it matters the most. Some companies, they have simple, you know, sales commission. So Navision does a pretty good job or sometimes just an Excel file can cut it. Sometimes the commission structure is a little bit more complicated. It may be more time consuming to put it together. You know, sometimes it takes hours and hours of people at the end of the month to crunch the numbers. Analytics is a tool that can usually expedite the process significantly, can sometimes completely automate it and even give like up to the minute commission in quota status. So throughout the month, anytime you pop and you look at analytics, you can see where sales people are, are they doing, are they falling behind and so forth. So sales commission is also very topic, important issue for analytics forecasting. Big, big topic. You know, everyone's trying to use their crystal ball to check you know what the upcoming sales are going to be. So you can basically better forecast your resources to tackle it. Analytics also can be very helpful forecasting sales, actually forecasting anything sales, GL expenses, inventory and so forth. Pricing strategy if you are dealing large contracts, let's say you know, if you're selling services or if you're selling products to, let's say, I don't know, big boxes, retailers. And you go into this multi year contract and you have to be sure you have the right price strategy. So you're going to be selling a lot, but you're going to make good money in the process. So understanding the cost components and volumes and so forth and being able to analyze those metrics and come up with the right price strategy is critical. And analytics can also be helpful in that front. Finally, some of the most popular requests as well as people have data information, sales data information coming from different places, not only from Navision. Sometimes you know sales is coming from a point of sale system, sometimes it's coming from the clients per se. Like if you have big boxes, they can give you some sales information beforehand and then you have to combine this data along with your Navision data to have a better understanding of your whole sales process. So the ability to easily integrate data for data analysis is critical. And analytics can definitely play a big role into helping with that. Let's talk a little bit about supply chain and kind of how analytics helps inventory management, just inventory transfer between your warehouses or where you put your goods in your own warehouse and how you can more efficiently manage your own hand inbound and outbound items. If you have, you know, bringing products or you know, from overseas, let's say, or if you are routing your products, your clients through different your own trucks and you want to have a better understanding and optimizing the logistics. Analytics can also help you with that supply chain collaboration. You know, if you need to exchange information with your vendors and your clients so you can have a better understanding of what's coming in, what's going out. So bringing data from vendors can be critical and analytics can be helpful just your purchasing processes, depending how simple or how complex it is. Analytics can give you into insights and you can focus in fine tuning some processes that maybe today you're just not aware that they are not being so efficient. Forecasting the same way that we can forecast sales, you can forecast anything in the supply chain, where the products are in the supply chain or maybe know the quantity on hand you have today, in the next coming Days, weeks or months. So forecast is a big deal. And analytics can help. And also data integration the same way, as I mentioned about sales, if you have information that you need to exchange with your vendors, with your shipping companies, maybe with your customers customers, you can combine all of this data into a unified analytics platform, then being able to analyze all of this data from a single location. So these are some of the most popular reasons people come to us for analytics. I kind of covered some topics for more than the distribution, manufacturing businesses. However, we have clients all over the place. Service companies, medical devices, pretty much financial companies, all over the place. So if you are outside of these topics that I covered and you want to learn more specifically how we can address your own needs, give us a call, shoot us an email. We'll be glad to hear where you are, what your needs are and go from there. So why data self analytics? Well, in a single sentence, what we do is, you know, it goes back to my vision when I founded the company is we're looking for the best of the breed, most intuitive and easy to use technology out there for analytics. And usually those things are expensive and complicated. So what we do is we simplify it, we make it easy, easy to install, easy to learn, easy to use, and we amplify it. It's not only an easy to use technology, but we add several components to it that will make it better out of the box. You get a lot of value. So we'll talk about it in a minute. And in a nutshell, at the bottom of this page you can see three different products. Data Cell, etl, SQL Server and Tableau. That's the platform that we use. We have our own technology, but we leverage SQL Server and Tableau, which are best of the breed, bi analytics platforms out there and make it simpler, make it better. So when we put together our solution, the most important component is back again to my vision. Business people, the people who need to make decisions, they're usually not necessarily computer savvy, they're not programmers. These are the people who need information that need to slice and dice things anytime, anywhere. They may be in a meeting, they may be on a phone call, they may be visiting the client on a coffee shop, and they need information. So being easy for these people to access data anywhere, anytime, and being easy to modify it as needed is the most important component of technology. And when I show the product, you're going to see how impressive and how easy it is this technology to be used by non IT people on the client side. Also usually this very sophisticated Very easy to use products. They have a back end system that should be maintained by it. We also take care of it. We also make a technology that is easy for it being yours, it, an external company or ourselves to maintain it. So when business people are trying to do something that they don't know how, they're not ready to take that step. The IT can come in and quickly tackle and make it fast for decision makers to continue to do their own ad hoc analysis. So easy is the most important component of our technology. We're always looking for ways to make it easier, to make it easier to access anytime, anywhere and easy to change. The other very important component, as I mentioned that we augment or we amplify the value of analytics is the core team of dataself has been working with BI and analytics for about 14 years now. And over these years we have built a very comprehensive out of the box solution that today if you get all the components, let's say from a vision in a CRM package, there are more than 2,000 reports, dashboards and key performance indicators right off the bat. So not only is it easy to use, but it comes with a very great starting point. And about half of our clients they start using the out of the box and that's all that they need. So that's pretty much the PowerPoint presentation we're running track on time because our technology uses this best of the breed technology. All the components are really high end. It's really fast and really sophisticated, yet easy to use. We compare it like a Ferrari using data self analytics. It's just like driving Ferrari. It's fast, it's impressive, it's really flashy. So let's take this baby for a test drive. We're going to cover three different topics in our presentation here. First of all I'm going to be talking about secured access, how people access it, securely access it. Then I'm going to show some of the out of the box dashboards and key performance indicators out of the 2,000 we have out of the box. And then I'm going to show some ad hoc analysis. So let's take this baby for a spin. So first of all, most of the users, there are different type of users that can have data self analytics like the power user, the admin user, the consumers. Most of the people will be accessing data software analytics through a web portal, using a web browser or a mobile device such as, let's say an iPad, an Android tablet or a smartphone. So there are different ways to consume information. So when people go to their portal again using a web or mobile device. The first thing is all of this information is stored behind secured frameworks, behind a firewall on a very secured cloud based system. So it's very secure information. Only people with the right web address and the credentials can log into it. Now when a person logs into this web portal, then the second layer of security kicks in. Meaning if I'm, let's say a salesperson, I would only be able to see the sales team dashboards. If I'm a person from the finance department, I would only be able to see the finance department dashboards. If I'm an executive, I would log into the executive dashboard framework, for instance. So the second level security is giving me only the dashboards that I have access to. Now let me just browse through some of the dashboards I have here. And these are the sample ones. They're mostly sales focused. So if I logged in here, this would be my, let's say sales team dashboards. Now when I open one of these dashboards, I'm going to click one of them here. The top customer by sales, then the third layer of security can kick in. So let's say this dashboard can be the same for all salespeople. However, if the security is properly set up, let's say suppose I'm the California account manager, when they open this dashboard, I would only see the top customers by sales this year in California. While let's say Mary, which is the account manager for Florida, she opens the same dashboard like I did and she only sees Florida top customers. While let's say John, which is the VP of sales, opens the same dashboard, but then he sees the top customers across all accounts. So security can be granular in that way that a single dashboard or report will automatically render information based on your own user credential rights. So that's kind of very cool and helpful. Now that I cover a little bit about how people access the information, let's take a look at some of the out of the box dashboards. And this is just one of them. We have showing top performers, in this case, top customer by sales this year to date. So we have bars which relate to sales. Bigger bar, bigger sales, pretty kind of obvious. Then each bar has a color schema which is represented by the gross profit here at the bottom. So I can tell this customer is really profitable. This one is really unprofitable, maybe a red flag, maybe we got to check why this customer is so unprofitable. And we also have these black dots which are represented by the percentage gross profit. So I have gross profit on a color schema on the bars as well as the dots representing the actual numbers here. So kind of interesting perspective. We have lots of top performer reports and dashboards on the sales, on the purchasing, on the gl, payables, receivables and so forth. Let's see some other more intriguing key performance indicators. Let me go back to the list here and open this. Usually looking at the top growth and decline of different metrics in your business is important because those things are growing and decline the most. Let me give an example to see how important that may be. This report shows top customers by sales change since last year to date. This can be quarter to date, month to date, week moving period, whatever it is. Anyway, on the Y axis I have top change, in this case, top sales change. So bigger positive means big growth, big negative means big decline. Looking at this particular report, if I have recurring customers, suppose I'm a distributor, manufacturer, whatever, that I'm selling to recurring customers, and I look at this top customer by sales growth, most likely they're being taken care of, they're buying a lot. Most likely salespeople are working closely with these customers. Most likely they're happy. So in this particular dashboard, maybe the top growth is not so critical because I'm sure they're being taken care of. Now, what about the top customer by sales decline since last year? What happens is usually salespeople are busy. They call, they leave messages. If people don't call back, it may take another month, maybe a few months for me to get back to that opportunity. And maybe there's something wrong with this opportunity. Maybe they're not happy, the competitor's knocking the door. So maybe there's some big issues here that if I can work in a timely fashion, I can reverse the trend. But in order to do that, I need to know what's going on. So reports like this can bring to your attention again, what's growing the most or declining the most in any given time. And, and sometimes out of those top growth and decline, something critical is going on and you need to act quickly. So in this case, top decline, why are these clients declining? Can you do something about it? So kind of interesting perspective. And we have many of these top decline analysis all over the board. Another interesting kind of analysis is what is called exception reporting. And exception reporting is analyzing things that are no longer happening. This is an example from sales. So again, I'm looking at regular customers that are not buying in the last 30 days. Maybe it's okay, maybe it's not okay. In this case. I'm looking sales that had sales in the last 60 days, but not in the last 30 days. Maybe it could be in the last sales in the last 90 days, but not in the last 60 days. Whatever. Very easy to change these buckets, but the point is why they stopped buying. Or maybe if you're looking in an inventory standpoint, looking at items that have been seen on the shelves for more than 60 days, why those are not moving. And maybe you have to make a promotion to get them out of the stock. Anyway, exceptional reporting shows trends that are no longer happening. And sometimes they can be informative for a business to do something about them. And we have again many of those exceptional reportings in different places anyway. So we have lots of dashboards in different areas here in my sample, I have CRM information, cost of goods sold, I have inventory information, price, strategy, purchasing, and you name it. Now one of the most important things is the ability to change things easily. And again, it goes back to the vision that, you know, business people, they're usually not that computer savvy necessarily. They don't know programming, but they need information and sometimes they need something different than what is available pre configured and they have no time to call someone else to ask for a new report. So the ability to change dashboards and reports on the fly is critical. And this framework is really one of the best available out there. And that's what I'm going to show right now, how easy it is to change things. So let me open this Sales by geography. Suppose I'm the VP of sales and I'm meeting with the west team and I want to discuss opportunities. So I'm going to click on the Sales by geography dashboard. By the way, to build a dashboard like this from scratch, it does not take an IT person, no, a business person. And we actually have many VP of sales salespeople, even the company owner building dashboards like this by themselves. And they're not IT savvy, they are business people. So they can do it. And to build from scratch a dashboard like this, it can literally takes minutes. If you just know what you want, it can build from scratch in minutes. And if you want to see that, call us. We can show on a one on one basis how quickly we can do that. Anyway, back to my example here. So I open this dashboard, I'm with my west coast team in here, I have a very nice dashboard that shows sales by state. Every state has a bubble, bigger bubble, bigger sales and then the bubbles they have these slices which are representing the aggregation of the invoice size. So I can see in California, I have a lot of large businesses, which maybe is what I want. I can also easily change the data here using the slider, so I can slide here and see how things are growing over the years. So kind of very informative here. I also have on the left here, salespeople, sales in my bars, profitability in my colors, and what the top products by Quanteshift were for my whole territory. Now I just want to focus on the west coast team. And I could be looking at this dashboard on my iPad, for instance, using my fingers, I could come here and select only those west coast states. And when I select them automatically, my dashboard will filter the information to only show salespeople sales and gross profit in what's being sold to those three states. So everything now is focused on the west coast side very easily. Very, very easily. Okay. You know, if I'm concerned about profitability, I can see that Sam, my top salespeople, is fairly unprofitable. So if I click on Sam now, what I'm doing is I'm only showing Sam sales in those three states and the products has been shipped. If I want to choose more of the unprofitable salespeople, I can use the control on my keyboard and select more people. And as I select more automatically, I change the sizes of my bubbles and I change the products being shipped so very easily with very little training. Actually, many business people, they learn how to make these simple changes on dashboards. We call the filtering changes with no training. They just come here, they poke around, click right click, use their fingers and they figure it out so very, very easy, anywhere, anytime they can have access to information like this. Now some business people, they may be more sophisticated and they want to have more ad hoc capabilities. Maybe they want to extensively change this dashboard on the fly in front of the client, maybe in a bar, talking with a prospect, or just bragging about their sales, whatever. So we can also give these people the following level of modification or ad hoc capabilities. It is the edit button. Usually the edit button is on. I mean, the edit button is only for the more intrigued and adventurous business people. But we have many doing it again, you know, high level business people. So let me show how that works. I'm going to click the edit button. When I click the edit button now I have all of the different components of my dashboard. So I had three different sections. You know, I have the sales by region. I have the top five products and the sales and gross profit by account manager. So I have each one of those segments of the dashboard. Now if I am, you know, suppose, you know, I want to analyze my salespeople, sales and gross profit in a more granular level and slice and dice it, you know, how can I do it? So first of all, here I have full capabilities. I compare. I can completely change the dashboard. If I click the show me button, it gives me some ways that I can plot the information. And if I would like to see numbers by the penny, I can click on this option. So right now that dashboard or that chart became a list of salespeople with sales by the penny and gross profit percentages. Okay, suppose that's what I want to see. But I want to see this broken down by product line, for instance, or product family, whatever that you want to see. Well, here on the left side we have what is called as the data panel. Right now I'm connected to the sales module because it's a sales dashboard for the sales team. And here I have dimensions like products, salespeople, customers, so forth. When they open one of these dimensions, I see sub components of that dimension. So customer information, account manager, customer name, Idaho. And this is like a small list because it's a demo version. The actual solution for Navision is much larger list of subcomponents. But they are easy to understand. A business person just come here and pick and choose what they want. So if I go to the product list, for instance, and I want to see let's say a product line, here I just drag and drop product line, let's say to my rows and voila. By salesperson, by product line, sales and gross profit. Very drag and drop, very easy, very intuitive. It doesn't take much for a business person that is curious enough to do this. Maybe you want to break this down by customer. You go to the customer, let's say customer name and you drag and drop to the report and that's it. So by salesperson, by product line, by customer. Maybe you want to reverse the order. It's very intuitive. Drag and drop things. When I put product line at the end of the sequence. So buy salesperson, buy customer by product line, sales and gross profit. Maybe you want to put time component to the report. You can drag and drop, let's say document date to my columns. For instance, right now I have sales three years, gross profit three years. Again, drag and drop and you get the result. This is really designed for business people. On average, more than 70% of the customer reporting needs of business People, they can tackle them by themselves. No need for it. That's our track record. The vision is to give a tool that business people can do the job by themselves. You cannot get rid of the it. We still have to maintain the back end and on average 30% still need some backend customizations, augmenting this list of reporting parameters, building new rules and so forth. The beauty is once it has done the maintenance, the back end. Now most of the client side customization can be tackled by the business team, which is pretty cool. All right. Finally, at any point in this product, if you want to go into more detailed information granular, you can for instance click ok, let's see about this amount here. I want to actually see the details behind it. I can click this view data option and this can be done also on, let's say on the, you know, on the tablet, on an iPhone. So these were all the transactions that were actually made up that particular sales amount. I can even download this information if I'm using, let's say a desktop or something. And now I have the information in Excel file and I could, you know, use Excel as a way to further manipulate it. So easy access, easy ad hoc, easy download, easy get into Excel, for instance. Alrighty. So I hope you have enjoyed your Ferrari spin. Let's go back to the PowerPoint and wrap up the presentation. So what about return on investment? So one of the interesting things is once you give business people the ability to, to make more informed decisions because now they can find data, they can change data on the fly, anytime, anywhere, so they'll make more informed decisions, hopefully better decisions. These people are usually the people who can move the needle. They can improve the bottom line and usually by a few percentage points, you know, 2, 5, 10%, depending how they use it. So usually if your revenues are like 10 million and over, usually if you improve the bottom line by a few percentage points, you're going to make a huge improvement in your business because of that. Usually data software analytics has a very fast return on investment. Sometimes we install the out of the box solution. People start looking at those dashboards out of the box right off the bat. They find some trends that were not good, nobody knew about it, and they can fix it right away. And sometimes it takes literally days to get return on investment. On average it takes weeks or months, but it's very quick. Having said that, how much this will cost usually is going to be in the low five figure investment for an entry level system with a few users. And the price varies depending on how Many users, how much setup you want, what kind of users. But overall it's a low five figure investment including licenses and services. Alrighty. I hope you have enjoyed the One Way Session presentation. We're going to open our Q and A session and because we have many people here, I'm going to ask you to actually use the GoToMeeting chatting panel to send your questions and we'll address them. So let's see if we have questions here. Oh, here's the first question, which is a very good one. How do we compare or what's the way we compare Data Self analytics with the JET Enterprise and JET Reports? Awesome question. Jet Enterprise and JET Reports, they're a great solution. They have been in the Navision market for a long, long time. Let me bring here another slide to show how we position ourselves in the market and where JET pretty much fits, at least in the way that we perceive the market. So this is the Gartner Magic quadrant for business intelligence and analytics platforms. If you may not know, Gartner is one of the most reputable companies analyzing technology out there. And this is the latest. It's actually almost a year old, so next month we should have the new quadrant. But overall, this is the latest. And making long story short, the higher a product is on the axis, the better it is. The more to the right it is, the more components the vendor or the technology has. So being too much to the right is not a big deal. It's usually more important for Fortune 2000 companies for mid market usually is important to be higher on this axis. Now here there are the most sophisticated, the best BI and analytics vendors plotted on this chart. Jet Enterprise and Reports. They don't even show here. You know they're not because they're not as good as these other players. Now what I want to bring to your attention are the top two from an execution standpoint, which is Tableau and Microsoft. Tableau is currently considered the king of the hill when it comes to data visualization techniques, user friendliness, slicing and dicing things. And Microsoft is considered the best BI infrastructure for analytics in BI overall. So what about them and what about us? Well, let me show what we do here. What is Data Self Analytics? Well, Data Self analytics is actually tableau. We have a noem of tableau. It's Microsoft SQL Server which is the best BI infrastructure out there. So we took the two best technologies out there, we add the our own ETL which simplifies the whole process, eliminating programming and we amplify it by making this whole solution out of the box, coming with a very comprehensive set of 2,000 reports, dashboards and KPIs, even including a light data warehouse. So what we are is the best of the breed out there. Tableau and Microsoft, we simplify it, we amplify it. Jet Reports and Jet Enterprise, they are great solutions. We call ourselves like the Ferrari because we're using the best ingredients when we're building this solution the fastest, the more sophisticated, yet easy to use. So we are kind of in the higher end. However, Jet Reports and Enterprise, we call the Bimmers, the Mercedes, the Porsche. Great solutions, lower cost, you know, if you have a lower budget, if you're not so concerned about being the easiest to use, the faster solution, Jet, it's awesome solution, go for them. You know, it's really going to be happy with it. We are more towards the, hey, if you want to give your business people something that they can actually take ownership and do more things by themselves, that is faster. When they click something, it comes up quickly. That's where we shine. You know, it's because we use best of the breed technology. Very good question. I'm sorry that my answer is kind of a little long, but it's important to cover this kind of concept when people ask us to compare with competitors. All right, let's check other questions. Let me go here to the panel. All right, the question here is how long does it take to deploy the solution? Very good question. On average, the deployment takes weeks, but not because it's weeks of actual work. Usually for a deployment of Vision, it takes days worth of work to get it installed, tested and trained. But usually when people buy, until we get users using the system takes a few weeks, three to four weeks. So deployment is usually pretty straightforward. Let me see the other question. So the question here is, is this a cloud based solution? Good question. Looks like we have some fairly technical crowd here. Let me show this slide here. So this is kind of the architecture and I'm not going to go into too many details here. So this would be the Vision CRM and other data sources you may have. We install on your on premises system this back end system which is an ultralight data warehouse. It will pull data from these databases and make it easier for reporting. This is on premises. Then we have the analytics component which can be on premises. It can be in a private cloud or it can be in our own managed services. So it can be anywhere. The end of the day, people will have access to all of those dashboards using desktop, web and mobile devices, either using a VPN highly secure behind the firewall framework or using let's say a your private cloud framework or our own managed services cloud. All of this framework is highly secured. You just have to check which one is more appropriate for you and go for it. All right, so let's see if we have more questions. Let me go back to the panel. How is it priced? So pricing overall, as I mentioned before, it varies significantly depending on specific needs. One of the components is do you have a small, medium or enterprise framework? So we have kind of three buckets of pricing depending on the sophistication of your ultimate system. So that's one of the ways that we segment pricing small, medium and large. And then pretty much the next component influencing price is number of users. So those are the two main components and we have different price strategies. You can have a subscription monthly, yearly and you can even purchase solution. So we're pretty much done with the session. We have a few more questions, but we will address them on a one on one basis. Let me open this session here. Just some final notes. If you have questions, comments, if you want to have a one on one discussion just to learn about this, even if you don't want to buy from us, it's okay. We're here to educate people, help you make decisions. The better decision, even if it's move with someone else. So contact us, we'll be glad to talk about it. We'll be glad to make one on one presentations, proposals, whatever it takes to help you decide if this is a good fit or not. So I really appreciate for your time and interest and I hope to see you around and talk with you guys in the future.










