Analytics for SalesLogix webinar
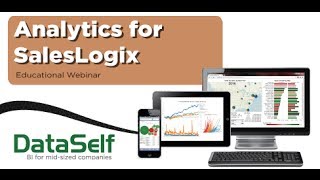
Johnny Girardi, DataSelf CEO, walks through Analytics for SalesLogix: a tool with over 2,000 pre-built dashboards for pipeline, campaigns, and commissions. It offers point-and-click editing, mobile support, and typically costs four to five figures. Most deployments take less than a month and show 1 to 5 percent ROI improvement.
Questions this video answers
All SalesLogix versions starting with 7.0.
Typically days to a few weeks; often less than one month for common deployments; heavily customized SalesLogix may take longer.
1–5% improvement to the bottom line.
Ranges from low four-figure (pilot/"get feet wet") to low–mid five-figure for common SalesLogix deployments; pricing varies by users and number of databases.
Chapters
Good morning everyone. This is Johnny Girardi, co founder and CEO of dataself. I hope you're having a happy Wednesday. Let's get this started. Let me control my screen here, put on there. Okay, so thanks for joining us. Today we're going to be talking about analytics for SalesLogix and before I jump into the presentation, just to give a little overview of, you know, why I founded this company back in 2005. I'm an electric engineer. As a background, in the first few years of my career I was the programmer, kind of a software engineer programmer. So I did a lot of heavy duty programming in my early career. Eventually I moved to the business area, did an mba, became an entrepreneur and then at one point I was exposed to the analytics and data warehousing industry and I thought that with my technical background and business background, I could make this industry better. When I started going to the business area, reporting data analysis was something easy for me. Because I had a heavy programming background, I could easily handle reporting tools, databases, that was comfortable for me. But most of my business peers, they had difficulties because hey, they are not necessarily computer savvy and they could not do the data analysis by themselves. They had to rely on someone else, a consultant, an IT person to do the job. So it wasn't efficient for them. So I thought, hey, I think I can actually make, make an improvement and make the life of decision makers. And even though the IT supporting decision makers better, easier, more value for them, that's why I started the business back in 2005. We've been working with SalesLogix and several other CRMs and ERP packages. The core team of DataSelf has been working with analytics and data warehousing for over 13 years now. And what we're going to be covering here today is the latest and greatest. So let's get it going. So I'll cover pretty much three main topics today. One is a handful of slides talking about why analytics. Then I jump into product presentation and at the end we'll do a Q and A session. So why people look for analytics when it comes to sales logics and sales related topics? Well, just going to cover some of the main pain points. People are looking for better opportunity in pipeline management, just understanding the opportunities, where they are, the odds to close them, how long it's going to take to close them, just managing the whole pipeline in a better way. Analytics can help a lot in ways to slice and dice that kind of information. If you're doing campaign and content management through your sales logics, that's also sometimes critical to just slice a group of people, how they're responding, how effective each campaign is, what kind of maybe sometimes words that you use in your campaigns that are getting better traction. So analyzing all that data can be critical. And analytics can help significantly. The data analysis, if you have support case management, looking at, let's say, a type of cases you're working on, how efficient the team is, individuals, time zones, time of the day, of the calls, a lot of ways to slice and dice the data. And analytics can also help you with understanding the processes at the end of the day. Usually you're trying to improve your sales, your profitability all over the place. So just understanding how you know, sometimes your saleslogix data combined with your, let's say ERP data and get a better understanding of your actual sales out of your initiatives and how profitable they are. So analytics can also play a big role combining the data and give you those kind of insights. Sales commission, you know, sometimes sales commission can be something difficult to put together. You know, sometimes it takes hours and hours at the end of the month of the week. Usually with analytics, you can have real time on the fly, easy to check, easy to follow sales commission structures. Finally, data integration. You know, sometimes when you're analyzing your sales logics, your sales information, you need to bring data from other places. Or sometimes you have to take your saleslogix data into some other place and combine with your email ERP information. Or you may have a point of sales information and then you have this single view of the whole business, regardless of where the data is coming from. And analytics can also play a big role with that kind of data integration needs. So these are the typical, not all, but typical data analysis needs that people come and look for analytics, data, warehousing, and we help them significantly. Now what it is the value we provide for the market. There's pretty much two slides that talk about value. When I decided to come into this business and make it better, my vision was twofold. One is I want to make it simpler. Often analysis reporting is something that requires it people that are highly trained to put together things. So I thought, hey, no, I can make it easy, easy for it, easy for business people. The ultimate goal is to empower business people to do the job by themselves. And our track record is more than 70% of the customer reporting needs of the business people. They can tackle by themselves. So there's no need for it, they can just do it. That's awesome for it. There's always things that it needs to do to make better for decision makers and also make it easy for them so they can more quickly fuel the business people is important. So we have tackled the IT side and the business side to make both of them easy. At the end of the day, we allow business people anytime, anywhere. If they're on the desktop, if they're using mobile devices, web, browser, whatever they are, they can grab information and they can easily slice and dice information. That's the ultimate goal. You're in a meeting, you're in a coffee shop, you need some information to make a more informed decision and you can get it. You don't need to call the headquarters, let's say. So easy is one of the most important components of our solution for both IT and business people. Second is that's kind of simplifying analytics. The next is amplifying analytics. So when you get an analytics solution like ours, it's super easy to use, intuitive. But hey, it's great if you get a very comprehensive library of dashboards and KPIs to get it started. And over the years if you get the whole olution that includes ERP data and CRM data, we have built more than 2,000 reports, dashboards and KPIs kind of plug and play covering sales, pipeline, analysis, inventory, if you have purchasing, receivables, payables, financials and so forth. So it's not only easy to use, but it's being amplified by having this comprehensive out of the box solution. And that's pretty much the PowerPoint introduction. Now we're going to take a look at the product and we compare data self analytics with like driving Ferrari is very fast, kind of flashy, very impressive. And there are many other competitors in the market, but usually they're not as fast, they're not as easy to use, they don't support as many devices like mobile devices so forth as we do. So we're like kind of the more sophisticated even though we don't charge a Ferrari cost like a Toyota cost. Anyway, let's take this baby for a spin and we're going to cover three main areas on this presentation. First is secure access, how people usually consume information. Then we're going to see some of the sample KPIs or dashboards out of the 2000. And finally we're going to show how easy it is to change things on the fly. So let's go to the product and the most common way that people consume data is using a portal, a web portal. And they can use web browsers on desktop notebooks or mobile Devices or also using mobile devices apps. And there are apps for iOS as well as for Android. So you have different ways to consume information. So there's three layers of security in place. First is only people who have access to the right web address, let's say and the right credentials can log into this portal. So it's highly secured. It can be on premises or it can be in the cloud. It's highly secured access. Once you log in, then the second level security kicks in. That means you can only see your own dashboards. So if you are a salesperson, you're going to be able to see the sales team dashboard. If you are, let's say a finances person from the finance team, then you see the finance team dashboard and so forth. So that's second level security. Now as I browse through here, my dashboards, let's say if I click one of these dashboards, one of these sample dashboards like top customer by sales, then the third level of security can kick in. That would be, let's say if I'm a salesperson and I'm looking at the sales team dashboards, when I open one of them, it would only show my own information. So if I'm the rep for California, these would be the top customers from California. While let's say Mary, which is the rep for Florida, she opens the same dashboard, she only sees Florida top customers. While John, which is the VP of sales, he opens the same dashboard and he sees top customers across all territories. So single dashboard and would fulfill or would render information based on your user credentials. So security can be granular to that level. So that's how security works. Now let me show some of these sample KPIs I'm going to cover like you know, showing sales and opportunity, it's kind of, you know, KPIs. This one that I'm opening is a very simple one we call a top performer dashboard. So we have here bars showing sales amount in a given time and then the color of the bars are represented by this color schema. So gives an idea if you know how profitable they are. I could easily see this is highly profitable client, while this one is highly unprofitable. Maybe there was something wrong with it and I have to work with this client to make better money out of it. Anyway, we also have these black dots that give the profitability specifically for each one of these clients. So very simple dashboard, but very informative, very insightful. And we have lots of top performer dashboards like this. Let's look at another one. There's also very intriguing. I find it a lot more intriguing for companies who have recurring customers. I don't know if you are like a distributor manufacturer that you are selling to the same customers over and over. This kind of dashboard is very critical because it shows the tip of the sales growth, the top growth and the top decline in a given period. In this case since last year to date. So bigger amount here, as bigger sales increase, bigger on the downside is decrease. Most likely. In this particular dashboard, these customers are growing the most since last year to date. Most likely happy clients, salespeople working closely with them. You know, probably there's not a big deal for a data analysis standpoint. However, these customers are declining the most in sales since last year to date. And maybe something is wrong. Maybe competition is knocking the door. Maybe they're not happy and maybe the sales team is not really paying close attention to them because they're not returning the calls. Well, guess what, if you don't act, if you don't know who they are, and if you don't act proactively, you may lose them for good. So looking at top growth and decline of anything, opportunities, sales, profitability, quantity, shipped cost, expenses, whatever, looking at the top growth and decline is usually important. And we have lots of these reports looking at the tip of the growth from any standpoint. So that's kind of a little bit more intriguing dashboard that we have available out of the box. Let's show another interesting catafino perspective that is usually also important. This is called exception reporting. Exception reporting shows things that are no longer happening. This is an example from the sales analysis standpoint. It shows customers who are buying from us before, but not buying the last 30 days. Maybe it's okay, but maybe it's not. So knowing who they are. And maybe you're looking at this dashboard, let's say people buying the last ninety days, but not in the last sixty days or in the last, you know, one hundred and eighty days, but not in the last 60 days. Any kind of time bucketing, very easy to change here. But the point is showing things that are no longer happening. You should be analyzing, I don't know, like items that you no longer happen, no longer selling or selling a lot less than in the past. So exceptional reporting can show you those perspectives and can be very insightful for you to focus on the right initiatives. Let me show a couple more. This one is looking at the opportunity standpoint. Open opportunities, close opportunities, and then we have salespeople here and then the bars and the color of the segments of the bar shows the probability of closing those opportunities. So here shows opening won and lost opportunities. And on the open ones it shows you by the color schema which ones are more likable to close. And here we have a big vision for all the salespeople, all the opportunities together. One last and open opportunities. Kind of simple dashboard, but kind of insightful. And then you can use filters to only see in the current quarter, current month, current year, whatever it is. So this is some of the kind of out of the box dashboards and we have things covering all over the place, campaign management, tech support and so forth. Now the most important thing that we like to convey is being easy, easy to access. So you know, all of these dashboards, I'm looking from a browser, but could be looking from, let's say a tablet, like an iPad. But how easy I can change things. So let me show that, let me show some ad hoc examples. I'm going to open this opportunity by geography dashboard and here I have a map of North America and we have bubbles in different states. And the size of the bubble relates to the size of potential sales. The bubbles have different colors and the segmentation is segmented by the certainty or the probability of closing those opportunities. Then I have account manager here showing how much the opportunities are using the same color segmentation. And then I see actually the accounts that have opportunities for this territory. So kind of, you know, easy to understand the dashboard. Now if I'm let's say a salesperson here or let's say the VP of sales and I'm meeting with my west coast team and I'm on an iPad and I'm the VP of sales, so I have access to everything. I could come here and using my fingers on the iPad, I could select those states from the half size of the country west coast. When I do that, now we change the dashboard to only show people who are selling to the west coast and all the probabilities for them and who the clients are. So by selecting those with my fingers, let's say on the tablet, I filter the complete dashboard to only show that if I come in and choose the salesperson here, now I'm further only focusing, let's say on the open opportunities that she's selling for those states in which the clients are so very easily a business person with very little training, they would be able to learn how to click and select the filters to keep on changing this dashboard dynamically. So let me reset the view here. So that's kind of very easy. It doesn't Take much training. Usually in half an hour, one hour, the average business person will be able to learn how to open these dashboards and how to navigate and filter the dashboards. It's fairly intuitive, kind of point and click, and you cannot break it. If you don't have the rights to change dashboards and save them, you can make whatever you want here. And this is not going to break the dashboard, it's just kind of a viewer license. Now suppose as a VP of Sale, I'm a more sophisticated user and I actually want to extensively change this dashboard on the fly. I want to slice and dice, drill down and so forth. Can I do it? Absolutely. It doesn't matter where you are. If you're using a desktop, if you're using a web browser on a coffee shop, or if you're using a mobile device, you can click the edit button. And when you click the edit button, now you have the power user interface. In here, I'm pretty much looking at the three different tabs I had in my dashboard. Three different segments of data. These are the three separately, each one of them, and now I can come to each one of them and extensively change it. So let me show an example. Okay. As the VP of Sale and I'm working with my team, I actually want to analyze these individuals one by one. And right now I have the same chart as I had in my dashboard. And let's say I want to change the feel of this dashboard. Instead of being charts, I can click the show me button and then it gives me different ways to represent this data in this kind of functionality here. The engine behind this user interface was designed by Stanford University professors. They analyze how business people look at data and have insights out of it. And they create this engine that actually helps decision makers walk through the journey of data discovery. You know, if you don't have an engine like this, the business people have to call an IT and a consultant, tell what they want, Wait, they get the result, they look well, can you change it? Go back, come back. Oh, can you change? Add more filters, Summarizes, it's a back and forth process, It's a journey. So this engine actually helps decision makers to walk through this journey without calling for support. So if I want to see a different kind of chart, I just keep on clicking on this different show me button. It will show me information using different visualization techniques. Just point and click. Anyway, so suppose I want to see just numbers by the penny. So here they are. I have my salespeople and then I have the certainty I Can swap columns and rows. So now I have salespeople inserting the top and hey, I want to actually add more information to my dashboard. Well, on the left I have information coming from SalesLogic's opportunity tables. And here the information is nicely organized for business people. Remember, this should be easy for non IT people. You know, salespeople, account managers, VP of sales that are out there in the field. So if I come over here and let's say I want to see my accounts, I open the account entry and I see account subcomponents. So if I want to add, let's say account name to my report, I just drag and drop, let's say, to my rows. So right there I have by account manager, by account name I see the print opportunities. Very easy, very drag and drop. Hey, maybe I have products in my sales logics, you don't want to add some product information such as product category, product group. You just do the same thing. You drag and drop. You can put in columns or in rows. You just drag whatever you want. Right there you have by account manager, by account, by product group, and that's it. This is something that business people with little training, sometimes, you know, a couple of hours, some people learn by themselves, some people take more time, four or five hours. But overall is a tool that decision makers, business people who want to learn it, they can also. It's very easy to download information for further analysis. So let's say suppose I look at this $47,000 here, which is currently 25%, and I want to see more information about it. I can click this View Data button and then I say I want to see the underlying data. And then I would see all the records coming from SalesLogix that are added up to that particular opportunity. And let's say if I'm on a desktop or in a notebook and I want to download this to, I don't know, an Excel, for instance, I can click to download this information and right there I download it. When I click on it, it goes to Excel. And now in Excel I have all this information and if I want to do some manipulation, Excel that I'm more comfortable with, I can easily do that. So anywhere, anytime, easy access, super easy to change things on the fly, and easy to download or export information and send to other people for collaboration purposes. So that's pretty much how the client tool works. Now let's go back to the PowerPoint and wrap up some concepts on the PowerPoint side. So what is the typical return on investment on a tool like Data Self Analytics. Well, it's fairly quick. If you think that people who are selling or who are making decisions or the people who can actually move the needle, like improve sales, cut cost significantly. If you give these people information, accurate information, anytime, anywhere, these people will be able to make more informed decisions in a timely fashion. They don't have to call other people, they don't have to guess. They can just do the job by themselves and by making decisions with more, by making more informed decisions, most likely they may make better decisions and they should move the needle. In our client base we have seen typically 1 to 5% improvement the bottom line. So if you are a company with let's say $10 million a year or $50 million a year, if you look how much 1%, 5% is in your bottom line, usually that's way over the cost of data self analytics. So that's how you measure roi. With analytics, it's how much more you can get out of your business if your decision makers make more informed decisions. Having said that, how much does it cost? Data software analytics cost usually is in the four to five figure investment. We have a very flexible pricing model that depends on number of users, number of databases. If you only have sales logics or if you want to combine with your ERP system or with several other databases. So depending on your unique requirements, the price can vary. Alrighty, we pretty much covered the content that I want to show and now I want to leave at least a good time to cover questions. If you have questions, please use the Gotomedi panel on your right side. Maybe you have to expand it to the left and you can make questions on the chatting area. Then I'll address them. So let me go to the panel and see if we have any questions popping here. Okay. Yeah, we have questions. So the first question, which is a very good question is how do you compare your Solution with the SalesLogix Advanced Analytics? Very good question. It's a very popular question when we talk about analytics for sales logics. So Advanced analytics is a module available from SalesLogix, which is an analytics module from SalesLogix and I think it was pretty much incorporated into SalesLogix back in 2011 by Sage. Anyway, Advanced analytics and let me actually take another slide here that will support my explanation right now. This one should be the one. Yep. Let me, Let me answer this question twofold. First of all, Advanced analytics, it's a great analytics platform. It's really one of the best out there as well. However, if you're familiar with it, it's not really designed for business people to build things from scratch. Usually advanced analytics is like a consultant or a business analyst is the guy who will maintain and build and modify dashboards and then publish to the business people will be the consumers. So it's easy to use, but it's not really focused on empowering business people to do the job by themselves. It takes quite some learning for business people to learn how to change things on the fly significantly and even building new dashboards. So it's not as easy as ours. That's one of the main differences. Ours is more focused on empowering business people to actually do the job themselves. That's difference number one. Number two, the advanced analytics is sales logic centered. So if you want to do analysis that is sales logic centered. Even if you're bringing other data, you can do it. Now if you are building, let's say an analytics platform that you want to work across your organization using sales logics, but also you want to analyze ERP information, plain sales on the ERP side, maybe order entry system, maybe your inventory, your payables, receivables and payroll. So if I have a complete platform analytics platform for the whole business, Advanced analytics doesn't cover that. It only covers things that are connected with sales logic. So it's sales logic centric, I would say. So that's the second difference. First hours is easier. Second hours can cover everything from an analytics standpoint. So this is kind of the more high level business explanation. Let me talk a little bit. Take appeal out of this explanation to tell why we are easier and more comprehensive than advanced analytics. What I'm showing on my screen now is the Gartner Magic quadrant. If you're not aware, Gartner is one of the most reputable companies doing technology assessment out there in the latest Magic Quadrant, as they call for BI and Analytics was released about a year ago, usually around February when they released the latest analysis. So this is about a year old, but it's still the latest. Anyway. Making a long story short here, the Y axis is ability to execute. Higher you order this axis, the better job these vendors are doing. The more to the right, the more tool sets you have in your BI and Analytics. So. So being more to the right is not necessarily great. It's usually more important if you're a Fortune 2000 company. So the more to the right, the better for Fortune 2000. But in the mid market, being more to the right is not as critical. So being higher in this axis is more important. Advanced analytics is actually powered by a product called Spotfire which is this one here. So it's actually in the top, top right quadrant, which is really positive. It's a really great technology. However, the top two vendors here, which is Tableau and Microsoft, let me tell very shortly what they are. So Tableau right now is considered the king of the hill when it comes to data visualization and analytics. Easiest to use, the most successful platform for the past few years, they went IPO last year and they were one of the most successful technology IPOs in the last couple of years. Very focused on analytics. Microsoft, they have a great platform for bi including data warehousing, analytics components and method pieces. So these two companies are providing the best of the breed platform for BI analytics. What about them? What about us? We. Well let's go to the next part of this slide here. So Data self analytics, actually what we do is we take Tableau, which is the king of the hill from a data visualization, easy to use business empowerment standpoint. We take Microsoft bi, which is usually centered around SQL Server platform, and then we add our own secret sauce, we add our own ETL tool which eliminates programming from these other two tools. And then we have added over the years more than 2,000 reports and dashboards to make a very solid technology. So what we do is we use best of the breed by far platform. We simplify it, we remove programming, we simplify it and we amplify it. We have a very comprehensive out of the box solution. So back to Spotfire. You know, they're not, you know, as high end as these other two guys and they only cover sales logics related information. They're not as easy to use. And the out of the box solution from Spotfire is not as comprehensive as ours. So that's kind of, you know, we compare pretty much advanced analytics in data self analytics. Sorry for the long answer, but you know this is usually a good question and I like to go over those details. Okay, let's see more questions here. So it's kind of, you know, circle back to the same topic. In a way it's advanced analytics, how the data integration works for other data, you know, data that are not related to sales logics. So the question here is, I think circles back to, you know, advanced analytics can only work with data that is directly related to sales logics while data self analytics can work with any data source completely independent. You know, we can have data set analytics for sales logics and we can also have let's say data set analytics, pulling data from inventory management tools completely unrelated or let's Say payables or receivables. And they are, you know, data analytics can completely be the platform to analyze your business's data across the board, while adjust analytics can only cover things that are directly related to sales logics. I'm not sure if I answered the question. Well, the other question here is let's see what SalesLogix versions do you support? So we support all SalesLogix versions starting in version 7.0. So we go back many, many years ago. So that's a good question. Next question here is, let's see here, how is the pricing structure? And give some ballpark figures of the solution. So pricing we like to tackle on a one on one basis because it can vary significantly based on your unique requirements. However, we have made our pricing structure in a way that you can start very small with a very small investment, get your feet wet and if you feel it's worth making more investment, then you can expand further. So it's very common for us to get the feet wet in the four figure range if you want to just be very conservative. Typically SalesLogix deployments will go into the five figure investment easily low mid five figures depending how many users you have. But we know that people are, you know, very conservative and they want to be sure the tool will work for their needs. So our price structure is put in a way that, you know, you can start with very little, you know, investment and move forward as needed. Let's see if we have more questions here. There's one more question here, so give me a little bit about the idea of the time to deploy data self analytics for sales logics. That's also pretty one on one type of answer. However, the out of the box solution has been designed to kind of connect to SalesLogix and give the basic reporting fairly out of the box in a way. So typically in a couple, maybe in a few days of work, we can get the system installed and configured for your use. If your sales logic is heavily customized, it may take more time, more days, maybe more weeks. Usually in less than a month your users will be using it effectively. So deployment, deployment, it doesn't take months, it's usually days, maybe weeks. Looks like those were the questions. So much appreciated. If you have more questions, you can send an email directly to myself. You can see my cell phone number here, my email and my Twitter account. So if you have more questions, feel free to email it to me or give me a call or tweet me. I'll be glad to go over, give more explanations about how our technology works or how we stack against different competitors, or how we can fulfill your needs. I really appreciate your time, and I look forward to speaking with you again. Thank you.










