A short demo by DataSelf AI describing how balance sheets and profit & loss (P&L) reports can be produced, automated, and viewed in Excel and Tableau. The speaker contrasts Excel’s formatting flexibility with Tableau’s interactive drill-down, filtering, multi-company and multi-currency capabilities, and notes distribution/automation features for web and mobile.
Chapters
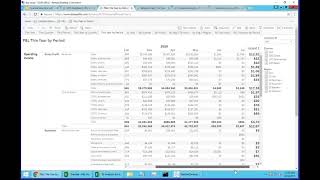
Now let's talk a little bit about balance sheet and profit and losses. Now when it comes to balance sheet and profit and losses, many of our clients still want the information to be showed in Excel. So let me start showing in Excel first. So I'm going to open Excel now and this is a very common kind of simple in a way, income statement in Excel, nicely formatted with the right spaces and columns and underlines, whatever you want with different metrics, whatnot. Once a Excel dashboard report like this is being created, pretty much the refresh, the report becomes completely automated. You don't have to worry every day when you open, the report is refreshed. So this is pretty much looking at actuals and growth year over year. When it comes to budget, fairly similar in Excel you have the freedom of changing the layout the way that you want. So information looks very clean, very organized and completely automated. Now we always encourage people to look at also their financials such as balance sheet, profit and losses in the tableau format. So let me go to some examples of the tableau format we have. And here I'm looking at P and L this year. Very simple. You know the formatting is not what is called the traditional format of a P and L, but it has things grouped the proper way and the numbers match. So format is a little different but you look in the same numbers and when you go to these tableau based analytics there's a lot more possibilities of how you can slice and dice the data and how you can arrange it. And it's so much easier to do those things in this example here. Let's say if I'm going to drill down from this level, I just click expand. And now I'm seeing more detailed information. If I click expand I can drill down to the next level and we can build drill down capabilities to go as far down as is possible with your data. And then you have the filters on the right if you want to just see for a certain division, certain region, different GL segments, very straightforward. And then out of the box we have actually a lot of pre configured of these reports so you don't have to start from scratch if you want to see let's say this year by period. So right here we have a P and L by month showing the total on the far right and then you see all the detail at the bottom. So very straightforward financials in the web format. Sometimes people want to license their financials by different GL seg. It doesn't matter how many segments you have 2, 3, 5, 10, 20, in the framework. Once they are mapped, they become easy to slice and dice. The data in this example is just another P and L. But then the segment two, which in this case is for division, is on the columns and then it shows a P and L for each division. And let's say, hey, in this case I don't want to see my direct division. I just uncheck that box and then I narrow down my analysis for only the commercial and retail divisions in the title says that right there. So very straightforward, very easy. These reports can be accessed using web mobile devices. You can also email them out and make the whole process of distribution. The reports completely automated. For balance sheet is the same idea, same kind of concept. You can come to the balance sheet and start expanding it, going, drilling down to more details, as far down as you want. So balance sheet and property and losses, you can't change much. The basic framework is the same. It, it meets the requirements of each individual client. It can be multi company, it can be multi currency. So very framework, very, very extensive framework to tackle different needs.