Cloud Based Analytics
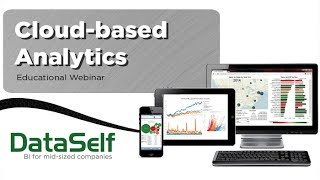
Gianni Giuardi walks through cloud analytics deployment models and Gartner's six components, then demos DataSelf's platform with over 2,000 ready reports. Cloud cuts entry costs and speeds deployment but ties you to the Internet and raises long-term expenses and control concerns.
Chapters
Good morning everyone. Happy Thursday. This is Gianni Giuardi, founder and CEO of dataself. If you are in California, you're probably not very happy with the traffic, but probably very happy with the rain finally. Anyway, thanks for joining us. Today we're going to be talking about cloud based analytics and before we jump into that part of the presentation, just a quick history about why I founded this business and what we're doing here today. So I founded it itself back in 2005. My background is electric engineering. I spent a few years in my early career doing programming, heavy duty programming and then eventually I moved into the business area. I had an MBA and as I was going through the business often I had to do reporting, data analysis. And because I'm pretty technical myself doing programming, I was very comfortable with the reporting tools, pulling data from databases and so forth. But most of my business peers, they had challenges. They had to rely on other people, often IT people to do that, to build reports to change and do data analysis for them. Not very efficient. So when I was invited to join the BI industry, business intelligence industry back in 2000, I quickly realized that actually I could make an impact. I could make this industry better. Using my technical background and business background, I thought I could make it better. So in 2005 I founded my own company, Data Self. And the main vision is, or was and still is, is to come up with easy to use technology, business intelligence, analytics, technology for business people as well as for IT people. So we can empower decision makers anytime, anywhere with the latest and greatest and with the focus on mid sized companies. So that was the beginning of dataself about nine years ago. We came a long way in the past. We were 100% on premises deployment. And with the latest technology we're also having cloud based deployment. So today's idea is to talk about cloud based analytics. We will cover a few PowerPoint slides talking about cloud based analytics, some concepts about it from a business and technology standpoint, it should be fairly informative section of the presentation and then the second session is going to be pretty much business focused on how people usually can take advantage of cloud based analytics. The idea here today is not to push you for cloud based analytics, is just to educate you. We have on premises, hybrid and on the cloud. So we want to just educate to see if this makes any sense or when it makes sense for you and we'll take it from there. So let's go for it. So first of all, when it comes to deployment of analytics, there's pretty much three Options you're probably familiar with on premises means everything is in your network, usually in your own building, whatever it is. Maybe you have your infrastructure on a colocation facility, but it's yours, it's behind your firewall, it's all yours. That's on premises deployment. If you do in the cloud, means it's kind of outsourced, it's out on the Internet, it's a provider, a third party provider giving you the cloud infrastructure, everything is over there. Or you can have what's called hybrid. Some pieces of the infrastructure you have, you own, it is in your domain and some pieces is hosted by someone else in the cloud. So those are the three main options for deployment on premises, cloud and hybrid. So what exactly is cloud based deployments? Well, usually there are three main components for the cloud based deployments. One is the software and the infrastructure is sold as a service through the Internet. These are one very important component of cloud based deployments. Something in the Internet that is owned by someone else and they charge you a fee, could be a monthly fee, a yearly fee or fee per use. Second is you know, the actual servers and sometimes services associated with the servers are all remote. Usually you don't know even where they are. And finally the point is the users will simply log to this portal or to somewhere in the Internet and they don't need to own software, they don't need to own the servers where they run, and they don't need to install anything. It's usually through free web browsers or through mobile apps that they can access the information from the cloud based deployment. So those three are the most important components defining what is a cloud based deployment. So what is cloud based analytics? So according to Gartner, which is one of the most reputable technology assessment companies out there, analytics has pretty much six main components involved. One is the data source, like your ERP package, your CRM package, your source of information. The other piece is what is called the data models. How the analytics recognizes your own data source. The next part is the applications processing your data. Then you have the computing power, the actual computer servers, RAM and so forth. Then you have the analytic models, which is pretty much a model that optimizes your raw data to become easy for business people and even to it to manipulate it. And finally is the user interface where you share and you store information. So those are the six pieces involved in analytics. And according to Gartner, if any of these pieces is in the cloud, any of them, then it could be considered a cloud based analytics. If all pieces are in the cloud, you have a purely cloud based analytics. If some of them are in the cloud and some are on premises, then it's a hybrid cloud based analytics. So what are the pros of cloud based analytics? So first of all, from a IT standpoint, your IT standpoint and your user standpoint, there's pretty much no need to install anything. You just through the web you can access the whole infrastructure. Also as the technology evolves and there is updates to IT or upgrades, it's all done by the cloud provider. You don't have to worry, you're just consuming. So no need to install, no need to update, no need to upgrade your software. Overall with the cloud there's a very low entry cost. You just pay a fee for, let's say a monthly fee or a yearly fee. You need to buy the software, you don't need to buy the hardware. So it's very low entry cost. And there's a cost predictability, meaning the more you need, the more you pay. And if you have to, if you're going to use less, you can just pay less. So you can control the up and down of the need as needed. If you are actually owning the software and you buy something, you make a major investment. And now if you're not using as much, you're kind of paid too much. If you need more, you're going to pay more. So with the cloud based, it's much easier to control how much you're going to be spending because you pretty much can have incremental increase or decreases as needed deployment speed. If I need an extra server, an extra 10 server, 20 servers on my cloud based environment, it usually takes minutes or hours to just enable them. It's very fast, is usually available. We use Amazon cloud servers and it's very easy to use, it's very easy to scale up and down as needed. So deployment to speed is impressive. Security Security is a big topic and definitely cloud based providers are paying big attention to it. So overall when you're getting reputable cloud based providers, you have professionally managed services. So these people are taking care that the latest and greatest secure technologies in place, applying patches, really focus on security. So it's really one of the best from a user standpoint to access this data is highly secured. But if you have the right URL and credentials, it's very easy for it or very easy for users to consume anywhere, anytime is pretty much having an Internet connection, knowing what the URL is, punching in the credentials and you are in. Regardless if you are a user of the system. Or if you as a company want to give access to your customers or to your vendors, it becomes very easy to give access to them, to those frameworks, because it doesn't have to go through your firewall and all the security that usually you have to worry about. And finally, because the analytics is in the cloud, not in your, let's say, in your own behind the firewall infrastructure, you're isolating both. You're not giving third party access or people outside of the organization access to your behind the firewall infrastructure, which is the most important assets. So from a secure standpoint, there are many pros when looking at putting analytics in the cloud. From a user standpoint, as I mentioned before, it's very easy to access it. It doesn't matter if you are using a PC, if you're using Mac, if you're using mobile devices, pretty much having a web browser or a mobile app, which is usually free, you can easily access anytime, anywhere. Finally, as I mentioned, it's very easy to scale up and down because in the cloud pretty much you have almost like unlimited resources available. You just have to pay more or less depending on your specific needs. You can even schedule during business days, you're going to have more resources available during weekends that can have less resources because it's not as much use. So there are many options when it comes to cost and computing power available in the cloud. How about the cons? Well, first of all, this is something that I don't hear that often when people talk about cloud based analytics. But to me it's a big, big con, which is it relies on the Internet. As you may know, sometimes the Internet is just slow. Even if you have a fast connection, it can be slow. Maybe you don't have Internet connection at all. So Internet is a bottleneck. And of course nowadays a lot of the cloud based solutions, they provide online and offline options. So if you don't have Internet connection, it's not that fast. You still have functionality available offline, but it's something you should consider. What is the impact of having slow connection? Sometimes not at all in your use of analytics, do you have offline analytics available? How will they work? Will they be sufficient? So Internet, it is a downside that sometimes or quite often is not a big deal. But in some businesses it can prevent people from going to the cloud because of relying on the Internet. The cloud reduces your entry level cost. But in the long run, depending on your needs and resources, it may be more costly. And it depends on a one on one basis. If you have, let's say, a good in house IT team that you need to have because of other reasons, and you could maintain this infrastructure in house because you already have the resources, maybe in house is the way to go. If your IT is always thinning resources, running out of emergencies and taking care of fires or whatever, then putting on the cloud usually is going to become much easier and less costly. So it depends on your case, but sometimes it can cost you more. In the long run, for sure, in the short term cloud is better, it's less expensive, but in the long run it may be more costly. When you put in the cloud, you have some loss of control over your assets, so you no longer have your physical servers and so forth. So sometimes it's actually good, you don't have to maintain all those things, but sometimes for some reason you actually want to have the physical access. And definitely when you put it in the cloud, it's someone else managing those things. And in some cases you want to have full control and the cloud is not the way to have full control. From a security standpoint, you're pretty much putting your data outside of your domain. For some people that's a no, no, they don't care, they don't want to do it most of the time. The security involved in cloud based analytics is sometimes better than what people have in their companies. But anyway, it's a trade off. You're putting the data out of your domain, you have to be sure, you rely on the provider, you have to be sure to check that the technology is actually the latest and greatest and you feel comfortable with. So that's one thing that you should pay attention to. If your company has to comply with extensive legal requirements, usually the cloud is not a good solution because you lose control of some of the assets and extensive regulation usually requires you to have full control of the data. So if you follow in the bucket of extensive legal requirements, cloud likely is not. At least the public cloud is likely not to be a good solution for you. There's also the discussion of the private and the public cloud. With private cloud, usually you have full control of the assets. So some of these things probably can work if you have private cloud. And if you want to discuss more in detail the difference between the private cloud and public cloud, we can address them during the Q and A session on a one on one basis. So what's the bottom line? What are the options? Well, pretty much your needs, your choices. If you are interested in evaluating if the cloud is right for you or when it's right for you definitely. We are available to discuss as I mentioned, we have options for on premises in the cloud and hybrid. We want to educate you to know what your needs are, what options are available and be sure that you're going to make the best decision for your business. So feel free to contact me or contact us anytime to talk about your needs and your choices. So now let's talk about data self analytics and I'm going to be covering the cloud based solution which pretty much looks exactly as the on premises is well as the hybrid solution. So why data self analytics? So it goes back to my initial vision when I founded the company that I want to simplify analytics and amplify it for the mid market. And we use the latest and greatest technology using Microsoft BI and Tableau framework. So let's take a look the main benefits and let's see a quick demo about it. So the first main benefit is just easy. Everything we do in our technology is looking at we want to empower it for them to be able to easily maintain the infrastructure of your analytics. But most importantly empower the business people to anywhere, anytime be able to access information by themselves. On average more than 70% of the customer reporting needs of business people, they can tackle them by themselves, anytime, anywhere. So we are empowering them with easy to use technology. Can be on a desktop, can be on a notebook, can be on a mobile device, on a coffee shop, in any meeting they can actually do that. Second is the amplifying analytics. Since we started the business we have created a very comprehensive out of the box solution that includes more than 2,000 reports, dashboards and key performance indicators right out of the box. If you have one of our main ERPs or CRM systems, very comprehensive, very impressive. So let's take a look at this solution. I'm going to break my presentation into three buckets. I'm going to talk about secure access, I'm going to show some sample KPIs and then I'm going to do an ad hoc analysis. By the way, we compare our solution in the mid market as a Ferrari because it's the fastest, the most sophisticated. Even though it doesn't cost a Ferrari, it it actually price for mid market. The cost can be from three to five figures depending on your requirements. So let's take a look at it. I'm going to go to the web portal. So when people log to this web portal they can log using any web browser, the most popular web browsers as well as mobile devices, they would log into a portal and then they would see dashboards that are related to their own specific criteria or credentials. So if I'm a salesperson, I would see the sales team dashboard. If I'm a person from finance, I would see the finance team dashboards. Now, when I open one of these dashboards, then the solution can only render information that I have rights to. So let's say if I'm the rep for California, this dashboard will show top customer by sales in California. While the rep in Florida opens the same dashboard and views only Florida customers. While the VP of sales opens the dashboard and sees the top customers across all accounts. So security can play in showing that kind of information. Now let me just show a few of the out of the box dashboards to give an idea how it works. So this is one from a sales standpoint and it's very kind of informative. We have bars showing amount of sales. We have the color of the bars that is represented by gross profit. So it's very easy to see that this customer is fairly unprofitable. Also we have these black dots that show the profitability on a percentage. So very easy. Very quickly I look at this dashboard and have an idea of how profitable and how much sales these top customers are. Another intriguing dashboard we have available out of the box or set of dashboards is looking at the tip of the growth of any or the most popular measures. This particular dashboard is looking at the top customer by sales growth and sales decline since last year to date. We have this analysis by quarter, by period for sales, profitability, expenses, you name it. So this is the sales change since last year to date. So these are the ones growing the most in sales since last year to date. And these ones are declining the most in sales since last year to date. Very informative, very important. So let's look at another example. This example here is what is called exceptional reporting. Exceptional reporting shows things or trends that are no longer happening and often that can also be important for a business. This example is also a sales analysis, exception reporting. Assuming I have recurring customers, this dashboard shows me the recurring customers with no sales in the last 30 days. So why were they buying in the past but not in the last 30 days? Very easy to change the buckets. It could be buying the last 90 days, but not in the last 30 days or you name it. The point is, looking at things that are no longer happening is usually important and out of the box. We have lots of reports covering those perspectives. Now let me show how easily these things can be changed. And sometimes that's Critical, you are opening a dashboard and then you want to slice and dice on the fly. So let me open this dashboard here. Sales by geography. By the way, a business person with little training can build a dashboard like this from scratch in a few minutes. It does not need to call it. So some business people that want to learn how to build dashboards by themselves, they can, they can do it on desktop, on web and mobile devices. It's really impressive. Anyway, so suppose I'm the VP of sales. I open the sales by geography, and suppose I'm meeting with my west coast team and I want to see and want to analyze only the west coast. I could come here with the mouse or with my fingers on my iPad, for instance, and select those two states. And right there I filter the whole dashboard, only showing the salespeople selling to those three states, how much they're selling, looking at the bars, how profitable they are, and also what products they are selling. On the map here, the bubbles are represented by this. The size of the bubble is the sales amount. And also I'm slicing the bubbles by the amount of the invoice sizes Anyway. Cool. Okay. So I see only the west coast sales. Now, if I click for instance, here on Sam, now I'm further drilling down into my dashboard and only what Sam is sending, those three states, how probable he is, and what products he's been shipping. Very easy to make these changes on the fly. If I want to see more people, I can use the control button and select more people. And as I select, the dashboard keeps on changing to reflect those changes. To learn how to do this, a business person sometimes needs no training. They just kind of poke around, left click, right click, they mark areas and they can find how to make sense out of this ad hoc analysis. Very intuitive. Now, if I'm a power user and I actually want to further drill down, slice and dice, create my own dashboards on the fly using web or mobile devices, I can do that too. Let me show how easy that is. So what I'm going to show next is not for everyone, but for those who want to do it, they can do it. So I have this edit button. If I click the edit button, then I have this user interface that gives me full capabilities on changing the dashboard extensively. So here I have all of those three segments of my dashboard. The top products by sold, the sales by region, and the account manager. Now suppose I come here and I want to change this dashboard extensively. I want to see actually numbers by the penny. I can click on the show me button and I can choose different graphical representations. So if I want to see numbers, I click this one and right there I see sales by salesperson and I see numbers by the penny. Okay, cool. Now what if I want to change this? I want to add more components, I want to see dates and so forth. How can I do it? It's very straightforward. Here on the left we have the data panel and I have business friendly names and structures. So if I want to break this down by let's say by product stuff, I come to the product segment and I just pick and choose what I want. Let's say product line. And then I can drag product line in my rows for instance, and drag it, drop it right here. So there it is by salesperson, by product line, sales, sales and gross profit. Very easy to use. Drag and drop. I did it. What if I want to break down my customer? I can come to the customer list, let's say customer name and just drag and drop. Maybe between those two or after, let's put at the bottom. So by salesperson, by product line, by customer name. It's just very easy. Just drag and drop. Let me put a product line after the customer. So by salesperson, by customer, by product line. Very intuitive. Maybe if you want to add dates, I can take document, date, let's say drag to my columns before the measures. So there it is. By year, my measures. Very intuitive. I can also click on any of these measures. Let's say if I want to see the underlying data, the details behind it, I can click on View data here and this will give me full access to all underlying data, every information you know, invoice number, invoice, date, customer address, you name it. You can download this information into an Excel file and you can further manipulate it. If you are using, let's say if you're using, let's say a desktop application. All right, so that was pretty much the quick test drive. Let's go back here to my PowerPoint and open for Q and A. So if you have questions, use the GoToMeeting panel on the right. There's a chatting box. Just click questions and we will address them. So let's see here for questions. Yep, we have questions. So the first question is what is the price of data? Self analytics. Very good question. So as I mentioned before, it varies significantly depending on your needs. We have, let's say cloud based monthly subscription and that usually will cost you from a license standpoint, hundreds of dollars per month or maybe into the four figures if you have a lot of users and a lot of needs. We also have yearly subscription and you can also purchase on premise solution. So the price can vary from three figures to four figures to five figures, even to six if you have a lot of users. But anyway it's very affordable to get the feet wet. Good question. Thank you. Next question. Let's see here. What is the technology platform of data self analytics? Good question. Let me see here. I have a slide about that. So this is the technology platform. So there is your data sources which is your ERP CRM and the other databases. We pull data from your ERP into an ultra light data warehouse which uses our ETL SQL Server technology. Then the data is pushed to the analytics component which usually can be on premise or in the cloud and then at the end of the day users will consume information using web and mobile devices. So that's our technology platform. We leverage Microsoft BI using SQL Server as well as Tableau Very good question. Let's see what else we have here. Questions. Another question Here is typical time to deploy? Good question. The deployment time depends if you're going to go if you're already in the cloud or not if you're going to go in the cloud on premises hybrid. So some of those questions vary. Overall most of our deployments so far have been on premises with some component in the cloud, but mostly on premises. And if you have a lot of on premises needs, usually the deployment will take a few weeks from you placing the order until your user going to get started. Usually that requires hours and days of work spread out in a few weeks. Well, we want to wrap up the session, it's 9:30. We really appreciate your questions and your time attending the webinar. If you have more questions or comments. If you want to discuss your cloud based or hybrid or on premises needs or just your analytics needs, feel free to contact us. You'll find here my cell phone information as well as my email and Twitter. Thank you for joining us. Have a happy Thursday and I look forward to hearing from you. Thank you.










