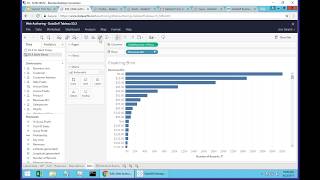
Learn how to create bins from a measure in Tableau's web interface. Select your measure, choose Create → Bins, set a bin size like $10, and Tableau groups your data: about 320,000 records fell in the $0–$10 range and 247,000 in $10–$20.
Questions this video answers
$10
About 320,000 records
About 247,000 records
About 24,000 records (as spoken)
Chapters
Create bins. Bins for certain type of analysis is very helpful. For instance, suppose you want to break down all your revenues in bins. You know, every $10, you know, you have a lot of small transactions and large transactions and you see how many of transactions is into different buckets of your measure. Before to create beans you'd have to use desktop. Now on the web you can choose a measure, choose create and choose bins. So here comes the little wizard revenues, revenues bin. And then let's say I want to see break in bins of $10. In this case, you know, I could ask the tool to suggest how many beans to break up. But. But in this case, I'm going to choose bins of $10 each. So when I create this bin, now I have a revenues bin here that has been created automatically. And if I drag to my rows. So what is. Let me sort descending. So what this is doing is from all invoices, from revenues from 0 to $10, I have about 320,000 records. From 10 to $20 is about 247,000 records. Let me just put the number of records as labels. So probably a little easier to read this. So how many records I have for transactions between 7 and $80? 24,000. So pretty much creating revenue, you know, beans from measures was only available on desktop, now is also available on the web browser.