DataSelf Analytics 9 for Sage ERP X3
DataSelf Analytics 9 adds over 5,000 pre-built reports and dashboards to Sage ERP X3. The tool cuts reporting labor and lets decision-makers build custom dashboards without technical skills using Tableau and other technologies.
Chapters
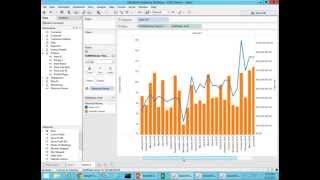
Who needs business intelligence or who needs analytics? Well, typically people who need reports, dashboards and data are people who are running the business. They're managers, decision makers, they're managing people, managing processes, building, selling, doing things. These people typically they're not necessarily IT savvy. So when they are meeting, let's say they are in a board meeting or maybe meeting with a client, meeting with their teams, discussing the business opportunities, the business threats. Nowadays quite often there are new questions, new you know, what's going on here, what's going on there. And quite often there are no reports to answer those questions anytime, anywhere. So these people that understand the business problems, threats and opportunities, quite often they cannot find information to help them make a decision on spot, to move on more quickly. Typically they have to call an expert, a report writer that sometimes is hard to access. Maybe it's outside of the organization. It may take hours, days or weeks to get the report ready, but they need the answer now. So people who need BI are usually not necessarily IT savvy. And that's what we're going to be talking about here today, focusing data self analytics for sage ERPX3 in how this analytics solution can help the decision makers, the people who need reports, who need dashboards, to be more self sufficient. So in a nutshell, making a long story short, if you look at the reporting tools available for X3, pretty much they're all what we call expert centric. Someone in the organization or an external consultant will have to spend a ton of hours to learn the reporting tool and to learn how to pull data from x3. And that person will be the one building and slicing dicing reports for everyone else. So the point is the decision makers of companies who use X3 quite often, when they have new questions, when they need to analyze some new trends, they'll have to contact this expert or team of experts to get the information. The opposite approach, which is what we propose is the user centric approach is providing an analytics in BI solution that empowers business people that have very little IT knowledge to become self sufficient, to be able to build and modify and slice and dice reports anytime, anywhere using desktop, web and mobile devices. So that's in a nutshell what we are talking about here today. So how can we provide a user centric technology while the competitors offer a what we call expert centric? Well this slide will tell how we can do that. This chart here is from Gardner. Gardner is one of the most reputable companies doing technology assessment for Fortune 2000 companies. In every year they assess how well the BI and analytics vendors are doing for Fortune 2000 companies. And making a long story short, Tableau right now is considered the golden standard when it comes to analytics. Easy reporting and dashboarding is the tool that had been most successful for several years in a row. Empowering decision makers to have easy access to data anytime, anywhere. Microsoft is one of the leaders when it comes to BI infrastructure. Well, what about these guys? What about Data self? What about X3? Well, what data Self does is we are taking right now nothing but the very best technology available from the upper market. So technology that Fortune 2000 are taking advantage of. Fortune 2000 companies are taking advantage of, you know, Tableau and Microsoft. So we take those products, we add our own secret sauce that removes complexity from those other tools. So make it easier, simpler, faster, and we add more than 5,000 reports, dashboards and KPIs out of the box. So for companies that own X3, you get the very best technology that Fortune 2000 companies can afford. We make it fast to deploy, usually in days. We can deploy this out of the box solution. We've been working with high n bi for a long time and with ERP packages like x3, including x3, obviously this solution costs literally a fraction of the cost if you try to get the same thing. The way we provide this user centric technology that empowers decision makers with an easy to use tool is because we're using nothing but the very best from the Fortune 2000 company. The most refined, the most supported, the most polished user interface for reporting, dashboarding and BI purposes. Let's take a look at it. So let's do it. So I'm going to jump right into the product presentation and I'm going to build the next scenario. Let's assume that I'm the CEO of this company here, a sample database that I have and I'm going to have a board meeting tomorrow. And one of the information that I need to share with the board is some new initiatives we have in our business. In this new dashboard that I need to put together. We'll have to go into detailed customer sales information because sometimes we have to see specifically some of the big customers, what they're buying and who's selling and so forth. We've been doing heavily marketing through website campaigns in social media and I want to see how that is affecting my sales on a monthly basis. And then also I'm trying to increase my large deal sales across different territories. So I'm going to build a dashboard that will show this little story about These three things, I'm going to build this dashboard from scratch to show how easy it is. Then I'm going to also pull some pre configured dashboards available out of the box solution covering some financial information as well as some critical trends out of my sales. Let's take a look at it. So first of all I'm going to build first that dashboard that shows detailed customer information, shows marketing website visitors and sales and how they are related to each other and then sales by territory. Let me build those reports from scratch. So here in this tool right now I'm looking at the sales connector which pulls Data from my X3 sales data and any other sales related data into this connector. Well, let's say I want to see sales information. So I drag my sales to my report and I want to see sales by customer. I want to see detailed customer information. So I put my customer into my report and right there I have sales by customer and then I also want to see by year. So let me put sales by year in this case in my sample database. I have three years. As you can tell, everything that I'm doing is drag and drop and I could be doing this on a web user interface or on a mobile device. Very intuitive. So something designed to be user centric. All right, so I have sales by year, by customer. But let's say I only want to see sales this year, only a slice of this data. Well, I put my dates on the filter shelf and then I can filter my data by different time buckets. So very intuitive to know. Okay, I want to see by quarter, by month, by year, fiscal period, you name it. I can also use relative date, which is one of the most popular filter approaches for dates in relative date exists because people typically are filtering things by dates comparison to today's date, let's say this month, this quarter, last quarter, this year, last year, the same quarter, last year, things of that nature. So this relative date has this very easy to use wizard. You know, I have the time buckets. If I choose year, I can see this year, previous year, the last three years, or if I'm projecting, I want to see the next three years. In my sample database I have the last year being 2014. So I'm going to choose previous year and I click. Ok, so now I have obviously that information and later I could come over here and change. You know, I can see maybe quarters or months or you name it. So you just pick and choose and quickly you get the information anyway. Okay, I'm building my detailed oriented report and looking customer sales in 2014. Well, I want to see invoice information, date, products and everything else. Well, again you just drag and drop. If I go to invoice details and I bring the invoice number, I just drag and drop and there it is. By customer, by invoice I have total sales in 2014. Maybe I want to put invoice, date, drag and drop, invoice date between customer and invoice number right there. Now I have the date. Maybe I want to see product, the warehouse, whatever you want. You just pick and choose, drag and drop and you got the answer. Building a detailed oriented report like this, it's very easy. Most business people learn how to do this watching a demo like this. In many of them, that's all that it takes to build dashboards like this. Pretty straightforward. All right, so this was my first part of my new dashboard was a detailed report showing detailed customer information. Well, the next piece of information is I want to see my marketing campaign around. My website is affecting my sales on a monthly basis. So this is usually better to look looking at charts, bars and so forth. So let me build a trend analysis looking at sales broken down by month. So I'm just dragging and dropping things. I have months here and I see my sales growing throughout the months. Now I also have website visitors that in this case is coming from Google Analytics and it could be maybe some information from the CRM system from Excel file. But in my example I want to see website visitors from Google Analytics. I drag and drop in my report. So these are website visitors. Let's make a bar for them. So website visitors are bars in sales. We have the line. Now if I want to compare to see how they are affecting each other, maybe I want to put both of these charts in a single dual axis approach. So very easy. Again, point and click, choose dual axis and bang, there you go. Look at this. Now I have the website visitors in bars, orange my sales and then I could analyze how my website visitors are affecting my sales and hopefully make some decisions out of it. With my board meeting tomorrow. Okay, this was a good dashboard for that purpose, a good report. The last part that I want to look at is I want to see my sales by state or territory in how large my deal sizes are. So I want to put everything on a map. I want to see by anything that has an address, let's say ship to information, customer address, bill to, they all can be put in a map. So in my case I'm putting the customer address and choosing the state. I want to choose Also deal size, which breaks my sales by small, medium, large, and my sales amount. Let's put all of this stuff on a map. There I have the map. Let's make the bubbles a little bigger. So bigger bubbles, bigger sales. And I see how much sales I have for different sizes of deals aggregate into those bubbles. Awesome. I think all of these three queries will be very helpful in my board meeting tomorrow. Let me build now a dashboard that puts all of them together. And I'm going to go with my iPad. So let me make an iPad format for my dashboard and then I just drag and drop the queries that I created into my dashboard here. I just pick and choose where I want to drop these queries and voila. Look at this. How quickly, how easily I was able to build a fairly sophisticated dashboard. And it does not require an IT expert. This tool, because we're leveraging Tableau, which is the leader in the Fortune 2000 world. We can actually empower users, business people to do these things by themselves, anytime, anywhere. Maybe some of these people are too busy even to learn these things. Good news is they don't need to call one person in the company. The expert they can call maybe a coworker, maybe an assistant that will be very able to build these things from scratch very quickly and push to a web server where now the right people would have access to information. So this is really user centric technology. All right, so this was the dashboard I created from scratch for my board meeting tomorrow. Now I also need to show some financial information that fortunately is already available in my out of the box solution. In this example, it's showing my financials, revenues and projection. So for different cost centers, I have revenues by quarter with the grand total so far this year. I have some other more specific metrics for this particular quarter. Here I have in this area by month, I have current month bookings, things already got the orders, I have pending open orders, and I have expected new revenues which may be coming from my CRM system. And all this information can tell me what my expected projection for the month is. And then here in the projection for the month, I may have more detailed information about how much is in my pipeline. What is the expected revenues, which is the same as this one. What are the expected close. I mean, this dashboard is just a financial kind of dashboard available that you can plug to your system. You can customize your own ways of looking at data, the way that you look at your periods, your cost centers, whatever it is, different charts and make this very informative for your Meetings with your board or whatever decision making process should take place. Alrighty. I also want to see, as I mentioned in my product demo here, top sales decline and no sales in my business. In this business I have a lot of recurring customers. I have a ton of customers and a lot of their recurring customers in. One of my priorities is I don't want to lose customers. If some customers are declining sales, I need to know and hopefully know what's going on to fix it. And if some customers are no longer buying at all, I want to need to know why, who they are and why and hopefully fixing the problem. So as I mentioned, out of the box, we have more than 5,000 reports, dashboards and KPIs and I'm going to show right now a few more available out of the box. So let me go to my top customers by sales increase and decrease since last year to date. So my board meeting, we always look at this. This report here shows me the good, you know, the good stuff. You know, people who are growing the most in sales since last year to date, which is awesome. But also which customers are declining the most in sales since last year to date. Of course, if my business was more focused on product instead of customer. We also have a report like this showing top products by sales growth and decline since last year to date, last quarter to date, you name it. The point is out of the box, we have a lot of those metrics showing the tip of the growth curve of your metrics and then you can see where you should be focusing your resources. So this is one of the dashboards we're going to be working on the meeting tomorrow. And the other one is no sales, which is like an exceptional reporting showing things that are no longer happening. In this case we have customers that were not buying the last 30 days versus the last 60 days, customers who are not buying the last 60 days versus the last half year or not buying the last year versus the last two years, three years or you know, these are some examples of, you know, how you can look at no sales, maybe which items I have no longer been selling for the last few weeks or months. So showing reports like this is critical and you could be using in meetings like, you know, the more meeting I would have tomorrow. So that's what I want to show as a product. As I showed, it's easy to build from scratch new reports and dashboards. Again, you can do that anytime, anywhere using desktop, web and mobile devices. And it's very easy to access dashboards and reports using this web portal very Secured. Let me go back to my PowerPoint to resume the presentation. So in a nutshell, what are the main benefits? Well, first of all, we really empower decision makers. The way we do that is because we're using enterprise grade user centric analytics. So it's really intuitive and easy to use. And we have more than 5,000 reports, dashboards and KPIs. So we're really pushing and giving decision makers a way that they can make this more informed decisions anytime, anywhere. That's really important benefit. Second is this tool overall will reduce your reporting labor by about 80%. If you're doing a lot of manual work today with your reporting copy and pasting going to excel, manipulating pretty much this tool will automate 100% of the repetitive tasks, crunching data, summarizing data, emailing data to people, sharing data with people through websites, through PDFs, through emails. It has a foundation to easily share information with other a lot of people. So you don't have to do this process manually. So data crunching and distribution of information is kind of completely automated by this tool. Finally, for you as an individual long term career, you're going to be working with the gold standard for analytics. You're going to be using the best technology that Fortune 2000 Walmart kind of company is using out there. And you as a professional, you're going to go to a different league, much more efficient. You're going to be spending less time crunching data, more time analyzing your business and coming with better decisions. So there's nothing better than using the best of the brilliant technology available, whatever your role is. So if you're it, if you're a consultant, if you are a manager, if you're the company owner having the best, it's really a great thing already. This webinar is set to Finish in about three minutes. If you have questions, please use the GoToWebinar panel to ask questions and I may have time for one or two answers. Let's see if we have questions. Yes, we have a question here from Megan. Do you have a list of the 5,000 reports? Megan, thanks for your question. Absolutely. I have let me go to my website. So if you go to dataself.com and go to Solutions and click Overview. And then if you go to this KPI templates and click on KPI Templates you come to this page that has the complete list of out of the box, you know, broken down by different reporting package. And if you click this download full list, you'll get an Excel file that will show every single report available out of the box. So use that as a way to get the whole list out of the box. Well, folks, we're running out of time. Looks like there's a few more questions, but we'll be answering all the questions by email. I hope you have enjoyed the presentation. If you want to learn more about our technology, about other vendors, bi vendors in the market, how we stack against them, or maybe tableau per se, please contact me. You have here my cell phone, my email, my Twitter account. I look forward to hearing from you. I hope you have learned this. And by the way, this webinar is being recorded and is going to be posted to our website. By the way, on our website, if you go to resources and webinars, we have a pretty comprehensive list of recorded webinars and this one is going to be posted on this page. So if you want to share with someone else, please feel free to do it. Thank you very much. Have a happy Thursday and I look forward to talking with you again. Thank you.










