Learn how to copy and export data from DataSelf Analytics Desktop to Excel, PowerPoint, or email. Right-click to copy crosstabs or images, use the Worksheet menu to export to Excel or Access, or save underlying records as CSV for use in other applications.
Questions this video answers
March 25, 2015.
$22 million.
About 3,000 records.
CSV (comma-delimited).
Choose delimited approach and select comma as the delimiter.
Chapters
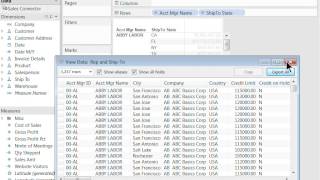
This video shows how to copy or export data from your data self analytics desktop into other applications such as Excel, PowerPoint, email and so forth. First of all, let's cover the most intuitive approach which pretty much uses the mouse. You point to the data that you want to copy or export, right click. So I'm going to point to the on a grid to the actual numbers, right click and then I have the option to view data or copy data. If you right click in other areas that do not have numbers, you get other pop up windows. So be sure the mouse is pointing to your actual numbers and then you right click. So here I'm going to start with the Copy option, choose Cross tab and then I'm going to go to Excel, right click and paste. So what we just did, we took the whole report and we copied a crosstab into Excel showing individual information as well as the subtotals just like it's showing here. So that's one option. Just right click Copy and Paste, choose Cross tab and paste into the application. If you choose Data, in this case, we only copy this particular data set, which is the 22 million. So I'm going to choose Copy Data, go to Excel, going to right click and paste it. And there you go. I just got that particular data which my mouse was pointing to that number and that's the same information right here, only for that data set. If I right click and I choose Copy image, then I get a full image, a full picture of the actual query. I copy it and then I go to the other application, right click and paste it, and I have the image of the whole report. This also works if you're taking pictures from charts, maps and things of that nature. Now I'm still pointing to this particular number. If I right click and I choose View Data in this little wizard, I choose Underlying. Now what I'm getting is all transactions that have added up to that particular number. So in this case I'm looking at sales information. All the sales line items that add up to this $22 million are here. There's about 3,000 records and I have detailed information in this case, invoice number, invoice date, customer information, product, ship to, you name it. I can now export this data. And when I export, it goes into a CSV file and I can save in a different location in my hard drive. I'm going to choose Save to save this information. And now I'm going to go into Excel and open the particular file. There it is, I just saved it. I click Open and This is a CSV file. So you choose please, please choose delimited approach. Click next and only choose comma click Finish. And now you have in Excel all those records in all field information coming from your transactions that now you can manipulate in different ways. So that's how you right click on a particular number and choose View Data. Now you can do these things using also the menu here worksheet. So the copy works pretty much the same way as we just did using the mouse over. But we also have the option here for export. And the main difference between the copy then export is export will save into file. If it's an image, it could be a PNG file. If it's data, it will actually save into a Microsoft Access format. But I also found export cross tab to Excel a very useful approach. Let me show you that when I do that, actually I export the crosstab in a nicely formatted way. So, so these are numbers, but they are already nicely organized. So if you're trying to export to Excel only for visualization purposes, the export cross tab to Excel, it was going to show you the data more nicely. If you were going to export, I mean copy the cross tab, then you have this information that is not so nicely organized. This is usually better if you want to manipulate the data further, but not to show it. To show it is nicer. If you look at this way in Excel or let's say PowerPoint and this export to cross tab here, they're actually numbers. You still can make calculation out of them. So it's better than actually exporting the picture if you're planning on doing any kind of calculation. My final comment is if you go to actual images or charts, the way that you export is fairly similar. When you export view data copy, you're going to be looking at numbers per se that are underlying behind this chart unless you choose the image approach that you're actually going to be copying the image into your other application. So right here I'm going to paste the image and you get the image just like it was in the Data Self analytics desktop. I hope you found this video informative. Thank you.