DataSelf Analytics for Sage Intacct
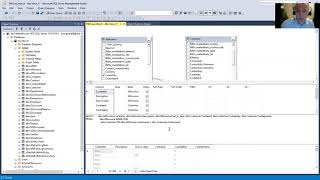
Johnny Girardi shows how DataSelf Analytics mirrors Sage Intacct data into a SQL Server warehouse, then connects BI tools like Tableau and Power BI for fast reporting. The demo covers the ETL process, table linking, and Tableau's natural-language queries and dashboards.
Chapters
Hi there, my name is Johnny Girardi, I'm Data Sales founder and CEO and I'm going to be talking about how data self analytics brings the next level of reporting and business intelligence for Intact, Sage, Intact and many other products, many other data silos. We're fairly new to the intact world, about two months old, but we've been doing this for 16 years with other ERP systems, CRM and other many data silos. So we're super excited to bring enterprise level BI easily, very affordably so you can get started today. So I'm going to show a few pieces of how the system works. If you go to dataself.com I'm going to start with the architecture to tell how the solution works. Pretty much we bring data from any data silo like Sage intact, we store the data or we mirror the intact data into a SQL Server data warehouse. This can be in the cloud completely, you know, serverless. You don't have to have any, any access to it can be on premises, it can be transparent, you can have full rights, all your options. But anyhow we mirror the source database in this case intact in a SQL Server database and we do that process by default using our ETL tool which is a tool that is very easy to build and maintain data warehouses. But you can also use other SQL Server tools in case you want to. From here we plug tools like Tableau, Power, bi, Excel, Reporting Services Integration Service, whatever you want to report out of SQL. It's easy to plug and now you have fast instant access to support decision makers with reports and dashboards anytime and anywhere. That's how the flow of information flows from the source systems all the way to decision makers. In the next few minutes I'll give a quick tour in SQL first because probably many of you are familiar with this platform. I'll show a little bit of the ETL process in how once you do the data warehousing, how easy becomes for non techies to leverage this amazing analytics platform that we're excited to bring to Intact. Starting with SQL. This is a SQL Server management studio. You do not need to know SQL to maintain, to deploy and to report out of data self. You don't need to, but if you do know, boy you can do a lot of it. You can have a mirror again of all the tables if you want to from intact into SQL Server database like this one. You can see you can use the regular SQL tools. So if you want to build a report combining different tables, this is pretty much SQL Server. Hey, if I want to take my invoice table and combine with my customer table drag and drop. You can link things here using the regular fields. In this case I'm going to just show using the customer id there's better ways to do it, but this is a very simple way to do it. Then you pick fields that you want from each table. I'm just going to randomly pick some fields here and randomly pick some fields from this table here. You link the tables, you save and once you have the data in SQL then you can easily get other reporting tools again like Excel, Tableau, Power BI reporting services to extract the data out of SQL. It's fast, it's instant and you have all the power and possibilities that this platform provides to do extensive reporting. Multi company, multi currency. It's SQL. Welcome back to having a framework that gives you the power for data geeks out there to take this to the next level. How do we maintain and deploy the data warehouse? We leverage our ETL tool and here on the left we have the source systems. In this case Sage intact. We pretty much have to connect your Sage intact. We have to go to the security, you know, the tokens. It's usually a 50 minute procedure for you to unlock your intact to give access data self. Then you can see all the tables available from intact and then you can pick the ones that you want to use for reporting out of the box where you have a couple dozen or so of popular tables for reporting pre configured. If you pick a table here you can see the SQL Server statement or the select statement that to pull the fields from intact and that's it. You know you can pull more tables. If you want to put another table, you just come over here, I'm going to take this table, double click it and now the table has been added. So is that easy. If you want to load the data, you click the load button. The data will be pushed from the intact cloud to the data self cloud. If you're using our data warehouse framework in the cloud we use AWS and Azure or it can be on premises and from there you can do the additional SQL server manipulation in case you want to ETL super easy. Usually the training is about 2 hours and you'll learn how to do a lot of things in data warehouse with data warehouse net without it it's a lot more complicated when you go to the out of the box. So out of the box we bring not only the tools but reports and dashboards using Tableau or Power bi. So now I'm going to show our embedded Tableau functionality. So once the techies, the people responsible for the extraction, get the system up and running. As a business user, what I really care is to make more informed decisions. So I go in and log to the portal. This is the Datasoft portal. Right now behind the scenes I'm looking at Tableau feeding this engine. Then I can see, let's say, hey, I want to actually do some ad hoc analysis. I can go to the natural language functionality and here you just need to know English. You ask a question, I want to see my top 10 customers by sales in a given period. You ask a question like in Google or Bing, you have several hits, you select the right one and the tool will answer instantly accurately the question with a new report like this. So my top 10 are these in blue. It also shows me the other ones. And it's that easy for decision maker to be more empowered to find answers to their questions without calling a consultant or an expert in reporting. If I want to see this in a chart in a text table format like in Excel, I quickly change to a text table. It takes two clicks. I can export Excel if I want to. Or maybe I want to see sales by customer state. Just pick the query, select it, run it, there it is to get sales by state. Actually my example should be sales by customer country because my sample database doesn't have much state data. But for countries it shows a little better more business in the US than in Canada. Also we have a lot of reports and dashboards available out of the box. So on day one, typically out of a half an hour, deployment management will be able to see a lot of reports and dashboards ready to go. Very interactive. If I click a data point in this dashboard, it changes the whole thing to show exactly what I want to analyze. And I can usually quickly from the high level dashboard, I can click show details and go and see granular information in a transaction format. And then you can export to Excel if you want to. That's it. So I hope you found this informative. There's a lot more things we can do. If you're interested in learning how we can take your reporting and analytics to the next level, please stop by our booth at the Transform or go to our website and click about us or through the Marketplace and we'll be here to first of all understand your needs, your reporting challenges and if we can help you, boy, you'll be in for a treat. We are passionate, we are big data geeks and we're here definitely to assist you to make more informed decisions. Thanks for your time. Have a great day.










