DataSelf Analytics - Tableau, 2018 year-end
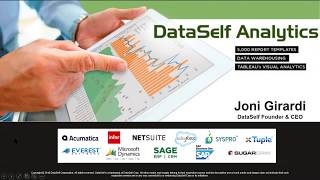
Johnny Giori, DataSelf's founder, walks through a Tableau-based BI platform built to solve slow reports and labor-intensive reporting. DataSelf ships with over 5,000 prebuilt reports, targets sub-10-second refresh times, and offers connectors to major ERPs and CRMs. The webinar covers deployment options, user roles, and a year-end promotion with 5-15% off and a 90-day money-back guarantee.
Questions this video answers
December 19, 2018
Reports should return data in under 10 seconds (rule of thumb stated by presenter).
2005
>5,000 out-of-the-box reports (speaker claim)
More than 1,300 sales reports (speaker claim)
Chapters
Good morning everyone. My name is Johnny Giori, I'm Data Sales founder and CEO and today we'll talk about data, self analytics, some BI concepts and also our year end promotion. Our agenda is pretty packed, so let's get going. The first some concepts about bi. Regardless of what BI solution you choose is, let's talk about the problems solved by business intelligence tools. The first and most important in my opinion is user empowerment. As you might know, people who need reports and dashboards that need to slice and that's their data are typically business people that don't have much time to learn complex reporting tools. So at the end of the day, your BI tool must be really easy to use to allow these busy, successful business people to access their data anytime, anywhere. And it's needed if they need to slice and dice it, drill down, export, Excel, even create new reports from scratch. If you can empower them to do all of those things, they'll be making more informed decisions at the right time and hopefully help the business be more efficient. So ease of user empowerment is a big problem that BI solutions solve compared to traditional reporting tools. The second problem that I hear a lot people complaining and eventually moving to BI solution is because reporting can be really labor intensive. Typically when I hear companies saying that they're spending dozens of hours on a monthly, weekly or daily basis investing into reporting, that means they're probably really ready to get a good BI solution to automate a lot of those labor intensive reporting tasks. What are examples of labor intensive reporting tasks? A popular one is data consolidation. Maybe the company has a multi company system that they need to bring the data all together to see, you know, data consolidated across all companies. Maybe they're just doing, trying to do inventory projection. You know, they have open purchase orders, open sales orders, quantity on hand, they need to bring the data together. You know, all the data is in the erp. But if you don't have a BI solution, combining data from different, you know, modules and tables sometimes is painful. So data consolidation is quite often a problem that requires a lot of labor intensive reporting tasks and BI can automate a lot of those hours. The next problem is just plain simple data preparation. I hear so many companies doing a lot of Excel like copy, export data to Excel, copy and paste, manipulate it, massage it, create macros and create charts, and spend hours and hours and hours on an ongoing basis to do data preparation before they can send to end users. So just plain vanilla, you know, can be in Excel, can be in crystal, other reporting tools. If you spend a lot of time Doing data preparation, BI can typically automate a lot of those. Finally, the other big bucket is just send the right data to the right time to the right person. We call report distribution. If you have a lot of users sometimes distribute reports to your board members and salespeople, customers that are looking to see their, you know, pending receivables. What not being sure you're not sending the wrong information to someone else can be very labor intensive, can be very time consuming, and all of these things can be error prone. When you have those problems, typically a BI solution can automate a lot of those procedures. The last problem that I hear a lot is just speed. Today people are no longer patient. Some reports take too long. How long is too long? It can be minutes, hours and even days. In our internal benchmark, if a report takes more than 10 seconds to run, most likely most users will not wait for this report to run. Therefore is mostly useless. So as a rule, all when we do, when we build our platform and we deploy for clients, we tell our clients you reports all of them. No matter how much data you have, no matter how complex your reporting calculations are, we Deliver reports under 10 seconds. When you press the refresh button in less than 10 seconds, you should see the data in very rare exceptions, sometimes it takes longer, but usually is in that time frame. Reports running seconds. So many people complain reports take too long. And if you have the right BI tool with the right expertise, you should be able to deliver all your reports to run under 10 seconds. So these are the problems solved by BI. And if you're going to BI nowadays is a great time. And one of the main options is should you go cloud or should you go on premises? Let me tell the high level considerations when looking at this question. Cloud on premises so if you go cloud, some of the benefits is time to value. Typically cloud based solutions take hours. It may be days to deploy a big BI framework, while if you go on premises usually takes weeks to do the equivalent effort. So time to value is a big benefit of going with cloud BI offers. Overall, if you put things in the cloud, there's a lot less pieces for you and your team to maintain. So the long term cost to maintain BI security upgrades and whatnot and backups is a lot lower on at your end. And finally, so many times I see people moving to the cloud because their users, typically business users, find it difficult to go through VPNs and loops and hoops, security loops and hoops to get to their data. If they're using on premises systems or private Cloud systems. So if you go with cloud, typically it's super easy for users to securely access the reports and dashboards anytime, anywhere, as long as there's an Internet connection. So those are the main benefits of the cloud. Why so many people go with on premises still, the biggest reason why is control. You know, some people, sometimes for regulation purposes or sometimes just because they want, they don't want to take their data and put somewhere else they go on premises. And if you go on premises, typically you have to be sure that you have an in house or at least a company out there that will be strong in IT resources to be sure these reports and dashboards will be up and running all the time and when people need it, it's refreshed and it's ready. So biggest value for on premises primarily is control as the benefit. My recommendation is as you're picking your BI platform, you should choose one that allows you to do on premises or cloud or hybrid. So in our example we have many clients that start with on premises and eventually go to the cloud. And sometimes we have clients that start with the cloud and eventually go to on premises. You will only know what's really going to be successful for you once you walk into the journey, no matter how much that you do beforehand, only once you walk into the process, you'll know if it's working well for you or not. So looking for vendors that provide again on premises, hybrid and cloud is a good option because you're not stuck with an option that is not working for you. You can switch gears in our case easily between cloud, on prem and hybrid. Typically in a matter of hours or days, we can completely switch the platform to be sure it will work for your needs. And if eventually decide to switch back or use both. If you have something like data self, no problem. So be sure to have options on your hands in case you decide to change later on BI users quickly. Typically when you have a BI system, you have people from IT involved in deploying this BI platform. You'll have what we call business analysts, typically users whose role will be to build and customize dashboards. For a broader range of users, you'll likely have what we call Explorers. Explorers are typically business people. They want to be independent when it comes to reports, dashboards and their own data analysis. They want to be able to get a BI tool that they can slice and dice it, they can drill down, they can export it, they can create new reports and dashboards without calling someone else. So these users are not as technical as the other two. But they still want to be completely empowered for most of their data analysis needs. The next type of users we call viewers. These users usually are not very sophisticated when it comes to BI tools. They don't need to learn how to slice and dice and create new reports. No, they don't. But they want to be able to look at their data, change filters like change periods, change categorizations, make some limited slice and dicing with very little training. Quite often there's a lot of users and a small number of Explorers and business analysts. And we also have the last category, which is users who only need to receive static reports, maybe PDF reports, maybe reports in an email, maybe in Excel files. These users sometimes don't need any interactivity with the reports at all. They just need to receive whatever the schedule is every day, every week, every month, every quarter, every year, a report showing what they care. In our experience it is usually 1, 2, 3 people involved in BI projects. Business analysts. Sometimes there's none, sometimes there's a few. Explorers is usually 5 to 20% of the users. Viewers is usually 20 to 50% of the total users, and aesthetic reports is usually the other 50%. That's usually how we see in the long run how BI licenses apply to different users. Now, how can you get better BI user engagement? I've seen so many BI projects fail because user engagement didn't go beyond one or a few users. What have we learned about that? How to improve the user engagement? How can BI help more people make better and more informed decisions? Well, one thing is the approach, the top down approach, which was upper management, tells everyone you gotta use. This was a traditional approach forever. It still continues to be many organizations and it works well. More recently in the last five to 10 years, the grassroots approach started in actually getting a lot of momentum. And the idea with the grassroots approach is just give BI tools to people who really need it. At least the interactivity part of it. Start with a small group of people, get these people excited, get these people successful. And as they become successful, naturally they'll be talking with their peers and the others who are going to say wow, that's so nice, that's so cool. I also want to be part of it. Can you give me a license or can you give me some reports? So the grassroots is usually less friction. There is a better, more solid engagement in the long run. Usually the overall user engagement is more successful because it comes because people want it, not because they have to. The second part, to get a user engagement, which is so hard for many BI consulting companies is to keep it simple at the beginning. You have to be very focused on very small number of actionable key performance indicators. If you push too much too fast, people will just push it back because they're not going to like it, they're not going to understand it, it's going to be confusing and you lost user traction. So don't, don't do that. Start maybe with only one report or one dashboard for users who are likely to not engage because they don't care much. And if you show these people one day that because of your reporter dashboard, they made a better decision, they made a better sale or they were able to cut bigger costs, if you make one win for them, they'll likely come back and say, wow, it really helped me. What else do you have for me? And then you go to the next level. And you go to the next level. So focusing on simple and small number of major KPIs is a great way to get user engagement with the broader community. I can also tell you that the business analysts and explorers, those two type of users will engage, they will make it happen for them. But they're usually a small number of potential users, usually again 5 to 20%. When you want to reach the other 80%, start simple with actionable KPIs and take one at a time. The other thing that is very important is be mindful of individual preferences. People are very different and if you try to push them to consume these reports and dashboards in a format that they don't like it, guess what? Most likely they're not going to look at, they're not going to consume these reports. And nowadays some people love Excel, some people like to receive reports by email or in a PDF format or they want to see on a browser, on a mobile device. So when you're getting a BI solution, be sure it provides as many different ways as possible to deliver information to users. To be sure at the beginning you're hitting every individual with the best way to get their traction. Alerts is a very popular one. Some people don't want to receive anything unless something important is going on. So being able to also have setting up alerts to automatically notify people, it's another feature that can help broader user engagement. When it comes to get return over investment from bi, there's two main approaches that you can start with your BI project. The approach number one I call is the start from scratch find the BI tool. Find people who know how to build things and start from scratch. And if you start from scratch, typically I See that things take usually several months. Usually if you look six months out, this start from Scratch initiative only built a small number of reports and dashboards. Sometimes, you know, only a few, two, five, ten, whatever the number is. But it moves slowly and in. One of the issues with this start from scratch is, I'm sorry, it's just the speed to get them done, but the risk of things falling apart, if things are moving slowly, moving forward slowly, sometimes priorities change, sometimes people leave or promote it, and then that project that started well just falls through the cracks. So my recommendation usually is find ways to get an ROI quickly, to get people engaged quickly in the solution, to guarantee that this investment is not going to die in a few months and to help with that, typically off the shelf solutions that have a much more comprehensive starting point can give your team value in different departments. You know, for finance department, for sales, for inventory, for payroll, whatever. The more users are engaged, the more likely you're going to be able to have continuity in your project and be successful in the long run. There's a lot of solutions off the shelf solutions out there. Data Self is one of them. And we'll talk more about Data Self in a minute. Well, let's talk about Data Self now. Let's start with the architecture of Data Self. We started this business in 2005 and since 2005 is about almost 14 years now, what we do is we start with the data sources and at the bottom I have a list of popular ERP and CRM system that we already have connectors ready for. So we bring the data from these source systems and other databases, social media, Excel files, proprietary systems. We bring this data into a separate database called a data warehouse, is a SQL Server data warehouse framework. And we optimize, we clean and we organize the data in the data warehouse for easy reporting. You know, if you have, let's say multi company, we can easily combine all the companies together. So when you look at the reports, it's like one big entity that you can slice it by different organizations or maybe you want to do, you know, sales forecasts, inventory projections, budgeting. We clean the data, we combine, we automate it, and then currently we're plugging Tableau. If you haven't heard about Tableau for the last six years in a row, Gartner, which is one of the most reputable companies doing technology assessment for Fortune 2000 companies. Gartner has rewarded Tableau for the last six years in a row as the gold standard for analytics in nbi, is the most empowering and Easiest to use Reporting tool dashboarding tool when it comes to business users, we've been building and refining this solution for again for about 14 years. And over these years we have built a lot of out of the box reports. Currently there's more than 5,000 reports out of the box covering financials, sales, inventory, purchasing, receivables, payables, CRM opportunities, payroll in other areas. So as soon as we deploy the solution, you don't have to start one report at a time. There's a lot of reports answering a lot of questions. You know, financials by year, by quarter, by month. This year, last year, growth declined. The idea is there's a lot of things ready to go and easy to customize. What are the key benefits of Data Self? Ease of use when we chose Tableau to be our main user Interface Back in 2012, this was the number one criteria. Most business people don't have time to learn complex reporting tools, but they are the ones who need reports, they who need reports changed, who need reports sliced and diced. So the easier the reporting tool, the easier it is, the more likely the users, the business people will be able to do those changes on the fly, anytime, anywhere. So biggest benefit of the Data Self application is ease of use. Second, out of the box, you don't have to build a lot of reports, you're ready, you just search. And when I go to the demo, I'll show some example of the power and how comprehensive the out of the box solution is. Third, quite often most organizations at one point they'll start to do data consolidation again, bringing data from different modules of the ERP system. Combine ERP with CRM, acquire different businesses and try to do consolidated financials. When you do data consolidation, having a data warehouse in place like Data Self makes things much easier, faster and more reliable to take care of the complexities of bringing data together. And finally, expertise. My core team has been working with enterprise grade BI and with mid sized companies and mid size ERP and CRM systems for about 18 years now. We know a lot of these systems, we know how to bring them into SQL Server data warehouses, how to use tools like Tableau for better reporting and how to help clients take the out of the box as a starting point and get value very quickly and be able to teach them and show them how they can easily customize the solution to fit needs that are not covered out of the box. A success story. So last year one of our clients, the cfo, one of our clients, he called me and he said that he has changed to a different business. And this would be his second data self project. And this time he wanted to do the project so very differently than the first project. The first project, he told me he wanted to, he needed some complex customizations to be done in the BI solution. And my team and his IT team took five months to get that complex, that complex customization done. It was a big project and he told me that, you know, that once he got the customization, he was happy about it, even though it took a long time. And the very next day he decided to see, well, let me see what Datafeld has out of the box. And in the very first hour as he was looking around at the out of the box solution, he found a report that was ready on day one, you know, five months before that show him some major inventory process issues that if he had seen this report on day one five months before, he would have told us, forget my complex customization, we have bigger fishes to fry. So he said, I don't know what I don't know. And your out of the box has so many valuable KPIs that what I want to do is just deploy out of the box. Let me look at my data, let me find if there's something important that I don't know. And then once I go to this process, we'll regroup and then we'll talk about what my real priorities are. This time I were around. I want to be the driver's seat. He said, I'm not a technical person, I don't understand databases. But when I look at my data through the data self approach, I can see what data is good on day one, I can see what data is garbage and someone will have to clean at the right time in what else I might need in my solution to be customized. But I'll be in the driver's seat. I'll be able to tell you guys at every step of the process what do I want? And one day I want it. I don't want to wait months for a customization that might not be my priority if I have something else to care about. This actual story changed how we position ourselves for all new prospects. We always say let's make phase one the out of the box. We can typically deploy the out of the box in hours, sometimes a day or maybe a few days, depending on the complexity of the project. We show the out of the box, we get the right decision makers engaged in the process so they can tell us, the data geeks, what's next. It's a very inspiring story let's take a look at the Data Self and how it works. Right now I'm using our portal dataselfbi.com I'm going to play the scenario like being the CEO of an organization. I can do this using a web browser. I can do this on a web browser. On mobile devices there are native apps like for Android and iOS. There are three clients also for Windows and PCs and Macs. But if I'm the CEO or a C level person, typically a lot of our clients, you know, C level people, what they want to get out of Data Self is some dashboards that have been tailored for their specific needs that they can usually open, let's say early in the morning to see if something is really good or really bad so they can take an action. I'm going to show an example here. When I log in as a CEO and then I have this 360 degree view of the business, the CEO wants to see things from all the organization like cash flow orders to ship receivables, revenues, Google Analytics, data financials. Sometimes things can get very busy like this dashboard. Sometimes it gets busier than this dashboard. Sometimes people only want to see one, two or three metrics no matter what. The idea is C level people super busy and you have to customize the dashboards based on their specific needs. The beauty is Data Self has 5000 KPIs ready to be plugged and someone can build this dashboard from scratch very quickly because pretty much each component of it is ready out of the box and you just have to assemble for this particular arrangement. Now the second thing is these dashboards usually must be interactive because once the C level person got an aha moment, they usually need to do it. Take an action like in this example, cash flow projection. I'm looking at receivables, payables, payroll in money in the bank today. So all the ups and downs in my cash flow for the next, in this case 60 days, when I add all of these numbers, I get the projection of my cash flow in the next 60 days. And as long as the most negative doesn't cross my line of credit, I do not have a cash flow projection problem. Now what if I want to see if something changes? If a customer doesn't pay me what's going to happen with my cash flow, I can play the scenario, I can come here and say exclude, let's say this payment. And now of course I force a scenario where now I will have a cash flow problem and then I might have to work with my CFO with My vendors to see how can I do to avoid running out of cash. So simple, easy, something that a C level person with little training would be able to read. A dashboard like this, make some changes, make decisions and take action. Another example red bars or red. The red color is something is not good. Like inventory assets is above my threshold here. What about it? Do I need to contact someone? Well right now I'm looking at my 360 degree view dashboard main tab. When I click on this red bar, it will automatically go to the second tab, the inventory tab that has more details about inventory. And now I can see that most of these red bars, you know it's too much inventory on hand is on the west warehouse. Aha. That's when you get the aha moment. I know who I need to contact. But then sometimes you don't remember who the person name is, what their email address, their phone number. Maybe this is a customer, maybe this is a vendor. Then you have to go to a list of search to find the contact. Well, we can build into these dashboards actions that when you click on a label, you can call, you can email, you can take an action from the dashboard right off the bat. And if you do this from a mobile device, so this is the same dashboard that I'm looking as here from a mobile device. You could quickly click the label, click contact and it places the call. So you don't have to know the person's name, you don't have to remember. You just click right there and you place a phone call or let's say you send an email message. So this is an example of C level kind of dashboard available out of the box. Let me show you now a salesperson kind of dashboard. So this is more like on the operational side, salespeople need to be on top of what's going on. And you as the organization, you can drive the process to let them be more efficient. Let's say you can show them in the main tab, major KPIs that each salesperson is responsible for. You can show what open opportunities are coming from CRM. If you work with the CRM system, you can show actual sales and commission for the past couple of months accumulating throughout the day. And also you can have what we call hot and getting cold performers. And the idea here is if you sell to recurring customers, who's hot or what products are hot? Where Worldwide, in the country or in the city is hot. By the same token, who's getting cold, what products are getting cold? Where is getting cold and As a salesperson, I just click a button, who's hot? I click the who's hot button. I go to a different tab. I was originally here. Now I'm the who's hot in out of the box. We show two ways to look at who's hot. Top customers by sales this period. Top customers are here and which customers are growing the most since last period. And the period right here is defined by this year to date. I could easily change to different time buckets. Like these customers, they are growing the most since last year to date. This is the actual sales growth. Maybe they're not big enough to be as a top customer, but because they're growing the most, we say they are a hot customer. What if you want to see, you know, by another measure, you know, by gross profit by quantity sold and whatnot, you just pick and choose in the report. We change right there now to show gross profit instead. So we have who's hot? We have what's hot. Now it's from a product standpoint we have where is hot in this case, looking at the state level. And we also look at things getting cold in this example, top customers by sales decline or gross profit decline since in this case last year to date or who is no longer buying at all. So these customers, you had some gross profit last year, last year to date, but now it's all negative. And if you put the mouse over these customers, it shows in the middle section which products are driving this decline. And if you want to see numbers by the penny, you can just pick let's see a few customers and you choose see details. And now you go to a different report that will show the details with numbers and pennies. If you need to see all of those level of detail, all of these reports I'm showing out of the box. It's very easy to customize. If you want to receive this report in your inbox, you just click subscribe. You put your email address here and the tool will start to automatically email on whatever schedule that you choose. So easy to self service. You can click alert. You know, if gross profit goes above something or below something only then send me an email. So there are different ways that you can let users configure how they'll be consuming the data. Self report boards. All right, I'm going to switch Back to the PowerPoint. Let me talk a little bit about the data self entry level pricing. So we have a quick start edition that starts at $4.99 per month. We have the pro edition that starts at $9.99 per month and the Enterprise Edition that starts at 1699. What changes between the editions? There's a lot of factors, but overall even organizations with hundreds of users can use the Quick Start. The Quick Start is very powerful. It covers a wide range of needs and yes, you can have hundreds of BI users investing very little in your bi. So what I encourage you is if you think that these kind of investments from a license standpoint is okay for your budget, let's talk about your specific needs and see which one will work for you. Which components affect pricing? There's additional user licenses and templates and a bunch of different components. We'll show you how much it's going to cost and then typically it's easy for decision makers to look at Data Self, look at the cost and say a quick yes or no. That's one of the bit of Data Self. It doesn't take a lot of assessment to see if the cost and the value is justifiable. Our year end promotions is if you order by the end of the year, we're offering from 5 to 15% off depending on what you're ordering. And sometimes even more importantly, we're extending a 90 day money back guarantee. If the solution doesn't work in 90 days, we'll return your money. We gladly extend money back guarantee when it's required and usually at the end of the year we do this for all orders. So that's a way for you to have peace of mind that we're also putting our skin in the game and being sure that we'll get your clients excited about Data Self. And again, if it's not the case, we'll return the money. In our company history overall there's a very small number of people who actually exercise the money back guarantee because we usually deliver what we promise for the cost that we promise. So anyhow, we do honor in case people want to return the software. What are the next steps? So if you want to learn more, I encourage you to go to dataself.com and I'll show you very briefly in a little bit some of the main popular areas of dataself.com if you want to order Dataself or discuss your needs, feel free to email to salesataself.com or call this number. This is my extension. We are recording this webinar and we'll be sending you a link to the recorded session so you can use the recording to share with your peers or review what we covered today. Let me quickly show you dataself.com in some areas or some pages that are very popular. So right here I have the homepage dataself.com if you scroll down to the middle of the page where you see these green buttons. This architecture shows the data warehouse how the components work together. Some explanation about it as a popular page. This button is really popular. I'm going to click on shows a list and samples of the out of the box reports. So right here, if you click this Download Full list, you'll get an Excel file that lists all the out of the box reports we have available. If you scroll down here, you can see what we have for CRM for every area, how many KPIs we have for core financials, there's 1500 reports and dashboards for distribution, distribution 4500. If you click on the sample button, you're going to go to different pages that will show some examples like I just clicked the sales samples. There are more than 1300 sales reports available out of the box. And here you'll have, you know, a few dozen just to give a pick of how these reports and dashboards look and how they kind of work. Another thing that is very popular on our website is sometimes people to have just a taste of how things work. So if you click the Try it now button, you will be able to. Actually, everything that I did today here was using the Try it now functionality. And it shows a lot of reports and dashboards and how you can navigate. There are videos built in that if you click on the videos, it will give you a little bit of an insight. Let me see if I find something here. Actually, when you land to the Try it Now, you're going to get into this page here that has sample dashboards and each one of them, they have YouTube videos explaining how to make sense out of these dashboards and how you can actually, you know, slice and dice them or even building new things from scratch. So I highly encourage you guys to take a look at the trial. It's using our sample database. But once this would be connected to your system, it will work primarily the same way as our sample database. Let me go back to my PowerPoint. I'm going to open a Q and A session now. So if you have questions, go back to the Zoom webinar page, there's a chat box and you can type in questions. And I'll be addressing questions now. So let me go to that chatting box and see if anyone has already asked some questions. I have a question here from Michael. I'm a Sage reseller with A large client base, but most are small organizations. What company size do you target? Michael? Good question. What company size do you target? Well, The way we have structured our pricing with the Quick Start, the Pro and Enterprise was trying to accommodate our pricing model to a wider range of IT budgets. We actually have. You said that you have a Sage reseller. Currently our biggest client base comes from Sage 100 and Sage 300 because we started first with those two products. So we still have the biggest client base with those two products. We're growing rapidly with the X3 and Acumatic and other systems and actually about 20% of our client base are with organizations that have less than $15 million per year in revenues. Some are only a few million dollars. Typically our pricing point. You know, it's not cheap per se, but it doesn't break the bank. Typically the organization must be what we say, data hungry. If they are data hungry. If they're spending a lot of time and money with, you know, labor intensive reporting tasks, usually when they look at our solution, they'll see the cost, they'll see the benefit. They're going to say quickly yes or no. And that's what we want, right? A quick yes or no. So it's hard to tell specifically what companies we target. We have just segmented our pricing model. The Quick Start targets company up to $50 million in revenues. The Pro is for companies that have targets revenues from 15 to 50 million and the enterprise for companies above 50 million. So hope that answer your question. We have time for one more question. Let's see if there's other questions here. Question from Chloe. How much training is required for data self? Chloe, good question. How much training? So it depends. Many of our clients, they get the out of the box solution that again comes with a lot of reports. We train them with the basics to customize the out of the box and usually takes a few hours. You know, we usually budget at least three hours of training so usually three to six hours. Get a lot of these organizations completely independent when it comes to customizing their own data self application. There's a lot of customizations that are simple. Drag and drop, point and click, you're done. Now there's a lot of organizations who have a lot more complex reporting needs. There's many organizations that actually want to learn how to customize the data warehouse in the web server. And when you go through the whole spectrum of possibilities, then training can take a lot more, you know, 20, 30, 40 hours of training depending of the complexity of your needs and how much they can learn enterprise BI is something that you can spend your whole career like we have done, learning and improving. So it's an ongoing process. But again just being more simplistic with your answer. A lot of reporting needs can be tackled with a few hours of training. Lot of them for many organizations, all of them. But you have more complex reporting needs. You know usually going to take you know dozens of hours of training investment for the more kind of no business analysts and IT people to understand how to fully customize all the back end of data self bring multi companies together doing data consolidation things that can be more sophisticated. Folks we gotta wrap up. I still see a few other questions but we'll answer them by email. Let me just go back to my PowerPoint here and show the last page. Again, as I said, this webinar is being recorded. We'll be sending you the link to it in the next day or so. Feel free to share with your peers. If you have any questions in the comments, feel free to contact me. Use this email address in my extension. I really appreciate for joining us and have a good day. Thank you.










