DataSelf Analytics - Tips for Calculated Measures
Learn to build calculated measures in DataSelf Analytics Desktop. The tutorial covers native aggregations like sum and average, creating calculated fields with arithmetic and percent-of-total formulas, handling nulls with ZN, and table calculations like running totals and year-to-date. A practice workbook is included.
Chapters
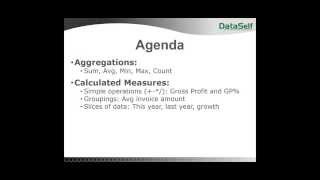
It's Thursday, everyone. Thanks for joining our session. Today we'll be talking about Calculating Measures, Part one, the Basics using Data Self Analytics Desktop, which is the same as Tableau Desktop. Quite often when people are building reports, they need to come up with different calculations. And like in Excel, this solution based on Tableau is very intuitive, very powerful. And we're going to be giving you today the basics how to get it done. So we'll have a pretty packed session. Let's get right into it. The first thing I'm going to cover is just different ways that the tool offers aggregation as a starting point. And that's pretty much you can summarize, you can do averages, check, minimum, maximum count, and so many other things. So let's take a look how that works. And by the way, this session will be recorded and will provide you with the whole recording as well as this package workbook that you'll be able to practice the same things you're going to be learning here today once the recording session is post on our website. So you have both the recording and the package workbook if you want to practice and review what we covered today. All right, so the first thing we're going to see is just how native aggregations work. So let me build quickly our report here. And by the way, the idea here is not to show how to do things except calculate and measure concepts. I'm not going to be covering filters and everything else. I'm going to assume you already know that. So right here I have a simple report showing by customer the totals for the whole company year. And by default this is looking at the sum of all sales. So pretty much every time you drag and drop a measure into a report, it will do an aggregation of all the individual records into this particular query. Now what if you want to see something else besides a summarization? Well, pretty much come here on this shelf. You click on this arrow pointing down on the pill and then you have the available native aggregations right there. So here we have sums, average, median and so forth. What are they? How do they work? I encourage you to play with it, but I'm going to cover here a little bit. If I choose average, this is the average sales amount. But what is the average sales amount? How it's calculated? Sometimes for you, in order to understand what's going on, you need to just break down the information, more granular level to come up with an answer. And I'm going to do that right now. So in order to understand how this average is calculated, I'm Going to focus in only one of these entries to make it simpler. But then I'm going to drill down all the way to the most detailed level of my information, which is I'm going to put my invoices here and I'm going to drill down all the way down to the product level in my sample database. This is the most detailed level information, which is sales details at the invoice line item. In my example I'm going to choose only two invoices, so I'm going to only keep the two of them and do a total here actually subtotals. All right, so now that I have the most granular level and I see subtotals, how is it being calculated? Well, let me add sales to my report again. So this is the actual aggregation of sales. So it takes every individual sums up. Every individual sums up all the way to the very top of your query. Let me take the sales and actually check count. Let me see how many records there are in every one of these aggregations. Let me add sales again, the total sales. So right here what I see is the sum, sum all individual items to the summarization level. This one counts how many records there are in that particular summarization level. In this, what it does, it takes the total and divides by the number of records, which makes sense. So in this case, average sales is giving me the average. It takes the total sales divided by the total number of records. Now sometimes what you want to do is not, if you want to see, let's say I want to say the average sales per invoice. Well, that's not it because this is invoice, line item, maybe the average amount by product or by customer, whatever it is. So I cannot use average sales for those groupings. I can only use the average calculation looking at the most granular level. Let me take to this other sheet here where I put the most popular aggregation modes. You know, there is the sum countoff, distinct count, average, maximum and minimum. And if you look at here, the minimum is the minimum within each one of these summarizations, the maximum obviously is the maximum. Distinct count sometimes is very useful. How does it work? Well in this case, why distinct count is four and not five? Well, because in this example, this, there are two sales which are the same amount. So this counts as only one is a distinct value. This example not so useful. But down in this presentation we're going to use a distinct count and it's very valuable in certain circumstances. So again, when you're building your queries, sometimes if you need a different kind of aggregation, check if you find them here, make sure you understand what they mean and go for it. It can be very helpful. One of the good news is when you're trying to get something done and you don't know how to do it, my first recommendation is Google it. Just Google by tableau average calculations and very often you'll find the answer right off the bat just by googling tableau and what you're looking for. Obviously if you need help, give us a call. We'll be very specific to your requests and hopefully give you answers as as effectively. Alrighty, that was pretty much about aggregations, the native aggregations. Now quite often you actually need to build new calculations and that's what I'm going to be covering right now. So the first new calculation we're going to be building is using simple operations such as, you know, plus minus times and division. And for the example I'm going to use gross profit and percentage gross profit because they have some very interesting spins to it. So let's go for it. So here I'm starting with a query already showing me by customer invoice number, product cost of sales, sales summarized and then I want to see gross profit which is sales minus cost of sales. Well I can simply come here to the measure section, right click and choose Create calculated fields and then we have this very user friendly wizard which is by the way version 9. What I'm using here I'm going to call gross profit and pretty much you can just drag and drop parameters into the expression. So I want to see sales minus cost of sales and that's it. I just created the new calculation. I click ok. So I have gross profit here and I can put into my report and put gross profit actually below them. And gross profit in this case is not showing as a dollar amount. So let me quickly change the format to dollar amount. Looks nice and pretty. And now as you can tell, the gross profit is this minus this at the summarization level is again this minus this and all the way down to the whole aggregation in any report. Easy, beautiful, no brainer. Now how about percentage gross profit? Well let's try to do the same thing. Right click create new calculated field. In this case I'm going to do gross profit divided by my sales and I'm going to call this GPP percent click. Ok, now I'm going to drag into my report and I'm going to say this is format, it's going to be a percent format. So again if you look at Every individual line. It works great. Percentage perfect. However, big surprise here. This is not correct. If you divide this number by this is something like, you know, 203.42 divided by 4026 is about 47%. Why is showing this number? This is tricky but very powerful. So let me go back to my GP calculation and edit it and explain what's going on. Well, what is going on here is for every single line at the most granular level, this tool is calculating the percentage gross profit. And then this is the sum of the all percentage gross profit. That's not what I want in this case. Yes, that was what I wanted in this case because it's just plain amount. I want to sum them up. But for percentages, I don't want to sum. I want to have this level to do the same thing as its individual level. How can I accomplish that? Well, then you change the calculation and you do the summarization inside of the calculation. Let me show how can I do it? I'm going to say I want to see the sum of all gross profit and then I'm going to do the sum of all sales. And then division applies. So what it means it sums this all, sum this all, and then divide them after the summarization. And if I do that and press apply now. And I have to re drag and drop because the calculation was broken. But you'll see that now we have the 47%. Whoopsie. Where's my. We had the 203.422 divided by 426. So we have 47% which is the correct amount. So this is very simple. This can be a little tricky. You may not get it right now, but it makes total sense. And it's very powerful because sometimes you need to summarize just like we did here. And sometimes you have to summarize this at the aggregation level, not at the individual level. So again, if you didn't get this right now, watch the video again tomorrow. This is simple and very powerful. And depending on what you want to do, you have to choose which one is the right scenario to go for. Alrighty, so that was gross profit and percent gross profit. Talking about simple operations. In pretty much all simple operations, that's what you want to know. What I just covered is what you want to know. What you need to know. The next thing you want to cover is groupings. In groupings is when you do any do a calculation at a higher level than the most granular. For instance, what if I want to see the average invoice amount. So let's take a look at that. So in this case I have customers and I want to see the average invoice amount per customer. Well, I could not do here just average because this average would show the average at the invoice detail level. If I want to do by invoice I need to know how many invoices each customer had in this any given period. So I need to do the uni count of invoices. So let's do that. I'm going to create a new measure, say right click create new field. It's going to be the number of invoices and then I'm going to bring the invoice number to my field and I'm going to say count D. What is countd? I mean I know this expression, but you can use this help here that has very different types of formulas that you can apply to your numbers. The count D when I click on it, it shows me here the expression in how it works. So it returns number of distinct items in a group, in this case how many individual invoice numbers there are in whatever that I'm looking at. So let me click OK here and drag number of invoices to my report. What this is doing is this customer in whatever number that I'm looking here, there's 7,371 invoices for it. So now I can do the calculation to do the average amount per invoice. So again new measure. Then it's going to be the average invoice amount. And now I can take sales and divide my number of invoices. Now when I do that, the tool is telling me there is an error here and if you click here it tells what the problem is. I cannot mix aggregate with non aggregate arguments. What is that? Well, what it's saying is number of invoices is an aggregation that is done right now is counting all records below it and bringing the total. While sales I have to put at the same level, which is I have to summarize all sales and bring to the same level. Just as I explained in the prior example, both expression must be either at the most granular level calculated and summarized or then summarized first and then calculated. And that's what I'm doing right now. I'm summarizing first and then applying the division. So now that I fix this and I click ok I can drag average invoice amount and here it is. What I have is this divided by this. Let's say, you know, if you want to know what Is the average amount per product. You follow the same kind of idea. You use an aggregation looking at the number of individual invoices or customers or salespeople. And C, you divide, let's say the sales divided by that count and you get the average. Alrighty, so that's about groupings and usually the distinct count becomes very critical for that kind of perspective. Next one is if you want to do slice up your data, if you want to use if statements. And in this case I'm going to use a very popular one which is you want to see let's say this year or this quarter and so forth. So let's go to the next section here. Slices of data. Right now what I have is for a group of customers, I have the total sales in the last two years. Well, I want to build a report that shows me this year in a column, last year in another column and then the difference between the two. There are many ways you can do that, but the way I'm going to show is because I want to show you how to build this using calculate the measures using if statements, which sometimes are very handy. So let's do it. I'm going to right click create new calculated field and the first one is going to be sales this year. And then what I want to do is say if my invoice date and here I could say no invoice date beginning January 1st all the way to December 31st. Too much work. So I can use an expression called year and year. As you can tell, returns the year of a given date as an integer, which is perfect. So if the year 2015 then show my sales otherwise shows me nothing. So that's it. This new measure will always show this year information. I click OK and then I drag to my report and let me make it this expression again. Currency approach. Is it doing correctly? I always recommend double check my example. I'm just going to apply a filter to see only this information. And if you do that, you'll see they'll match. So this is calculating exactly what I wanted. Perfect. Now let's calculate last year. Well, here's a new trick that I use a lot. Instead of creating a new measure, I'm going to take the prior one and I'm going to duplicate it. There are two benefits when I duplicate it for this particular example. One is I get the expression already with all the formulas. And in this case I'm only going to choose 2014 and it's going to be easier, faster. Not only that, but once I finish the formula and I drag it to my report. The second thing is it came with the formatting. I don't have to choose whatever formatting that this formula has. It's just a duplication with the same formatting as the original one. Awesome. So this is sales last year and if you want to double check, just apply a filter in this example. You'll see they'll match. Awesome. This is doing what it's supposed to. Well, let me remove sales here and now. What I want to do is actually do last year minus this year. The difference between the two. Well, I can come here again. Let's say I'm going to duplicate so it comes with all the formatting and then I'm going to edit it. In this case, what I want to do is this year minus last year and then this is going to be the growth. Let's call this minus last year. Create the calculation and drag and drop. Now something else happened. Why the heck is all no all nos? Well, it's not by accident that I chose this option. Let's see what's going on. Well, theoretically when I look here, I'm making this column minus this, minus this Y is blank. Well, if you're dealing with reports and if you're manipulating data, you probably know that if you're trying to add, multiply, divide anything by a null amount, you'll get null. So quite often when you're building your reports and you may have nulls in your calculation, you got to be sure you apply this very handy formula called the 0 null formula, the Zn or 0 null formula. Let me do that here. On both what it does, it will check the expression value. If it's not null, it will return whatever the amount is. But if it is null, it will bring a zero. And now you can add zero to numbers. So once I do this zero null conversion and I click apply now voila is doing the proper calculation. So again, maybe you didn't get this right. Now I recommend you to watch the video again or give us a call. But overall computers don't handle nulls in a sometimes humanly expected fashion. So applying the kind of formula and will help you tackle the right things as needed. All righty, let's move along to the next part of the presentation. Oh, by the way, before I do that, so these formulas, they are actually hard coded to 2014. So this is actually not last year, this is actually 2014. If I want to have this as last year, what I can do is I use the year calculation again and I do today. Today means Today's date. So here I'm getting the year from to date, which is 2015 minus one. And that will give me always last year, regardless what last year is. I'm going to click ok and as you can tell it didn't change. I can come to this year, change the format also to year today. And there you go. Now these two measures will be this year, regardless what the year is. Right on. Let's move along now for table calculations. What it is and what is the value of table calculations? Well, all these expressions that we've been looking so far. When this tool runs the query, it sends the request to the data source and bring backs the result from the data source and just displays it. Now, table calculations are calculations done on top of this data that has been returned to the desktop client and we're going to show some examples right now. Typically they are calculations across a table. Maybe you want to see the difference between columns or between rows and maybe go columns and then rows. And this is what this explanation is going to cover right now. So the first one that I want to use the table calculation is I want to see year to date amount. So when I take this amount, when you go to the Q2, I want to add the first plus the second one. When I go to Q3, I want to take the last one plus the accumulation of the prior one and then restart all over for next year. So I want to see a year to date accumulation. How can I do that? Very straightforward. You can build table calculations using the formula editor. However, if you click the arrow down here and you come to this quick table calculation, you'll find here the most popular table calculations ready to go. So in this case I want to see the year to date total. I just choose it and right there I got it. Did I? Well, I always recommend you to double check because things can be a little confusing if you don't know what you're doing. So let me add back sales to my report. So right now actually put sales calculation at the bottom so I have sales per quarter and then is the year to date sales. And if you look right now, first quarter is the same second quarter. If you add this plus this, you'll get this. If you add this plus this,. You get this. It restarts all over and goes to the end. Awesome. That's exactly what I wanted. It was so simple. Once you know what you're doing, what if you want to see year to day growth, it's just as simple. Let's take sales and convert into year to Date, growth, that's all that it takes. And right now, if you check this divided by this, you get this, this divided by this, you get this and so forth. So table calculations and these quick table calculations are very powerful and so handy when you're trying to make this kind of table across rows or columns calculations. Alrighty, let's go for the last part of our training today. And this is going to show some other things you must consider when you're looking at table calculations. And they're very, very important. Well, in this example, what I want to see is growth from the prior period. Well, let's say I could see growth from February to. From January. I'm sorry, from January to February, from February to March. So just go down on the list. Or perhaps I want to see growth from the same period last year. In this case, you're doing the difference between the columns. How can I do it? It's easy, it's beautiful. You just come here, go to quick double calculation and choose difference. Now what you get out of this can be a little tricky. And that's what I want to show you what to do. So what happened here? Actually, I don't know what happened. Well, again, bring the original measure back to your report and let's put the measures at the top here. So right now I have the new measure, the calculated measure, the table calculation along with the original measure. And what is this showing? Is the difference in sales from the previous along table across. So what this is doing is taking this minus this and putting here this, minus this and putting here. So what it's doing actually is sales change from the same period last year. And if that's what I wanted, beautiful. This is show me how much I grew from the same period last year. That simple. But what if I want to see the growth going down the table, not going across? Well, what you do is you go back to this, the pill that has a little triangle, which is the one that has the table calculation. You click on it. And then you see here how the calculation is done across the table. Right now is going across the rows. If I choose down, it's going to go down the rows and I can choose to go across and then down or down and then across. I mean, the popular options are all here. In my case, I want to see just table down. So what I have now is if you look at this, this minus this is this, this minus this is this, and so forth. So this is showing me the growth from the prior period going down the table. Now what happened here? I don't have the growth from the last month. Well, in this case I can just drag my year to my rows. So now I would see for January the growth from the prior month. What about this one? How can I get this populated? There is a way to do that, but I'm not going to show today because this is just the basics, folks. We're running right out of time. I hope you have found the session informative again. Tomorrow you'll have a recording session available, as well as the workbook that you can go through again in practice and see how things work. If you have questions, if you want to talk with us about this or how these things can be done, give us a call. We'll be glad to take you to the next step. Thank you folks. Have a happy Thursday and looking forward to hearing from you in the near future. Bye.










