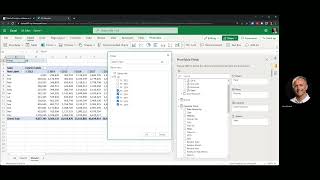
DataSelf AI shows how to build sales reports in Excel pivot tables from SQL Server data. Two examples: sales by year and month with date filters, and year-to-date comparisons with dollar and percentage variances broken down by customer and item.
Chapters
This is a quick overview of data self analytics and how users can take advantage of Excel as the reporting tool to get their data automatically directly from SQL Server. The power step into a pivot table in Excel or using tools like Power BI or Tableau as a way to get the data. So now I'm switching to the Excel online experience. Right now I'm already connected using Excel pivot table. Currently this pivot table is coming from a Power BI data set. However, again this can be done pulling the data directly out of the data warehouse, SQL Server data warehouse or from the Data cell framework. I'm going to show two simple examples. The first one is simply showing sales by year and by month. So you come to the pivot table and you select sales. Right now all the sales are here, but I want to break down by year. So select the date hierarchy and in my columns I have years and then I also want to break down by month and put my month in my rows. So right there for all the months I have sales by year in my sample database. The date the data is Currently data is October 2018. And this is plain pivot table. If you want to say, let's say only a few years, you could come over here and say I just want to see the last two years of data. Click OK there it is. 2017. 2018. All right, that's a very simple example. Let me reset this. The next example that I want to show is sales this year to date. Sales last year to date meaning 2017 through October. In the variances in this example I'm going to be using the extra measures that already have pre calculated this kind of KPIs. It's easy for users to create their own metrics like this. And once the metrics have been saved in the data model, then users just have to pick and choose. So if I see prior to date this year to date variance in dollar and percentage right there I have the result showing in my report. Now I want to break this down by customer. I simply have to find my customer here selected and there it is. For every customer I see sales last year this year in how the variance is going. If you want to break this down by something else like item, you just add item to the report and there it is. Now I have for every customer I have the breakdown by item and showing those four metrics. I hope you found this demo informative. Thanks for watching.