DataSelf and Tableau – BI, analytics and data warehousing (Full Webinar)
Johnny Girardi, CEO of DataSelf, walks through BI options for mid-market companies. DataSelf bundles a SQL Server warehouse, ETL tool, and Tableau with a library of 5,000 pre-built reports. The demo shows how to build self-service dashboards and create a single version of truth across your data.
Chapters
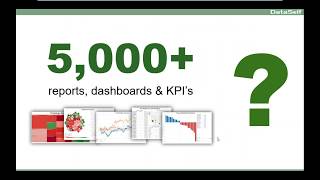
I like to start this webinar with this slide because in the mid market there are many BI offers and these are some of them. I've been working with BI for 17 years and quite often people ask me what about these different options, how did I self stack against them? So what I want to do in this presentation is talk a little bit about BI generically, regardless of what BI tool you select. So that's what our presentation. My name is Johnny Girardi, I'm Data Self founder and CEO. And the agenda is again, first of all, a quick overview of the BI options and how to make your BI project successful. Then I'll talk about Data Self, I'll do some demo and at the end I'll open questions. I'll also have a few polls throughout the presentation. All right, so a regular BI journey. Most companies, how they do it, if they go through what I call a regular BI journey, well, usually they have a ERP system. And the ERP system comes usually with its own reporting tool and BI platform. And for many companies it works really well. Many companies also have a CRM system, a payroll system and Google Analytics and Excel databases and a lot of different data sources. And again every system has its own reporting tool and sometimes its own BI tool. And for many organizations this framework, every source data with its own BI tool works well. But for many organizations that they need more, they need faster and better, they need to integrate data across all of the systems. Quite often these embedded BI solutions don't work well. Sometimes it's impossible to bring data from other data sources, sometimes it's possible, but the people involved in the process, they don't know how to do it and it just doesn't work. So it becomes expensive. Many different BI tools, many people to maintain them. It's hard, hard to maintain. Quite often the there are performance issues, slow reports, they take forever. And sometimes some organizations, the decision makers because they cannot get data across all data silos, they say scratch it all, I'm going to start something from scratch. And they go through major changes. So that happens quite a lot. And it's what I call a regular BI journey. If you're not happy the way that your system is operating from a reporting BI standpoint, then usually a better way is what I called a more structured BI journey. What is a more structured BI journey? One of the most critical components is having a data warehouse. What is a data warehouse? A data warehouse is a data repository where you can bring all of your data sources, your erp, your CRM, Google Analytics, payroll Social media data, external Excel files, whatever you have as data silo, you can bring into this consolidated data source. So the first main advantage is data consolidation. Maybe multi company with different systems, doesn't matter, you bring them all together. Second is single version of the truth. This is a way to guarantee that all of your main metrics, your KPIs are defined in a single place in the data warehouse. Let's say you define how your gross profit is calculated in a single place on the data warehouse. Maybe you look at your revenues minus cost of sales, or maybe you change to also include shipping and handling because now you're doing for free. So it's a single place where you have this calculation in all your reports will pull this gross profit from the single location. So you, you don't have the situation where you go to a meeting and every person, let's say, bring a different report and sometimes the reports were looking at different rules to calculate gross profit and you don't even know about it and you're making decisions based on inaccurate information. So data warehouse can guarantee a single version of truth because of that functionality. Speed. If you want the reports and framework to run fast, usually you have to have a data warehouse. And finally with a data warehouse, overall you get much easier reporting. Now that's the back end, what I call the pipeline of your BI solution. On the front end, you have to have an analytics tool in. One of the most critical features of the analytics tool list is a fuse. Most of the time, people that will be accessing your reports and dashboards, they are not IT experts. They are business people. They know business, they know how to manage people, build things, sell things. So you need to give them a tool that they can easily see their data, slice and dice it, drill down and even build new reports from scratch without calling for an expert. So ease of use is really critical. Second, speed. In our experience, if a report takes more than 10 seconds to run, most likely many business users will not run that report. People have no patience. It was going to be a waste if the reports are taking too long. So speed is really critical. You have to have a platform that runs reports in seconds. Finally, people have different needs to consume the reports. Maybe they're sitting on a desktop, maybe they're using web browsers, maybe they want to use mobile devices, maybe they want to receive alerts. So you need to have a platform that will render information the way that the users want to consume them. Not how you want it, but how they want it. So very critical to have different ways to Access information. Now, when you take a more structured BI journey, it's very important to have BI expertise. You need people that will help you select the the right platform that will help you deploy it and maintain in the long run. If you don't have the right BI expertise, it might be a bumpy road. So that's a more structured BI journey. Now what are three main ingredients to make your BI journey successful regardless of what tool you select? First of all is what is a right BI platform? Maybe something simple, quick and easy. Maybe is the more structured BI journey. Yes, having the right BI platform is critical and you need to pay attention to it. Once you select it, then be sure that you have people who will know how to deploy and maintain the solution. Sometimes you can build this knowledge in house very quickly. Sometimes you need partner with other companies to do a good job or hire more people. So be sure you have the right people expertise. And the most important component in my perspective is be sure you engage decision makers in the whole process. BI at the end of the day is for them. It's for people who make more informed decisions. And a lot of the BI benefits, the pros and cons are very business oriented. It's not tech talk, it's actually a lot of business conversation. So be sure the decision makers are engaged in the assessment, understanding the pros and cons, not the technical details but the business benefits. And you help have this project you know really well sponsored with the right budget, not too much, not too little, the right budget to make it successful. So be sure you have those three ingredients. So what is the right BI journey for you? Well overall I tell if you have inexpensive BI issues, you're not spending a lot of money, not a lot of time. The regular BI journey that I showed before usually works really well. If you have more expensive BI issues, a lot of people working with reports and a lot of time complexity, decision makers complaining it's slow. Most likely the structured BI journey is the way to go. My Focus Data self is on the more expensive BI journey, so we'll talk about it very quickly. But before we do that, I'm going to open a quick poll so if you could just answer quickly. Select the options that apply to your business and click the submit button. So be sure to select the options and click the submit button. Ten more seconds. Don't forget to click the submit button. Five more seconds. All right, I'm closing it and let me share it. So difficult to use in slow are the most popular ones pretty common. Thank you for your feedback. Let's move along. So let me talk about Data Self analytics in Data Self. You know we've been doing this for 12 years, for actually 17 years. My core team has been together for 17 years and we focused on the more structured BI journey. So what we do is first of all we have put together a BI platform that uses top ranked components. So it's enterprise grade and I'll show you a little bit about it. So we have a top ranked enterprise grade BI platform. Second is in these 12 years of experience we have built a lot of reports out of the box so you don't have to start from scratch. There's a lot of things plug and play. We expedite the time that it takes to get value out of this enterprise grade BI platform. And finally we have expertise, BI expertise. We only do bi. We have been working with mid size for ERP and CRM system for mid sized organizations. We know their data sources, we know how to bring to data warehousing, how to use analytics, how to put it together and deliver value. So this is what we do day in, day out. Top ranked enterprise grade bi, a great out of the box solution and expertise from a BI platform. What we use is some of the best technology available for Fortune 2000. This slide shows Gartner Magic Quadrant. Gartner is one of the most reputable companies doing technology assessment for Fortune2020 in every February. They tell how they assess, they make a report assessing how well these Fortune 2000 BI vendors are doing. Make a long story short, Tableau and Microsoft have been leaders for many years in a row and that's what we bring for mid sized companies. Nothing but some of the best technologies available for Fortune 2000. So looking from the architecture of an enterprise grade BI solution for data warehousing we use SQL Server which is one of the most reliable SQL Server platforms out there. Instead of using SQL programming, we have built our own ETL or extraction transformation loading tool. This allows us or whoever is maintaining the data warehouse to do the job in a fairly code free environment. So so easier and faster. For the analytics platform we leverage Tableau, which in the last five years has been rewarded as the gold standard for analytics by Gartner. So it's one of the easiest to use and fastest analytics platform out there. And in these 12 years we've been doing analytics for mid sized companies. We have built more than 5,000 reports, dashboards and KPIs. So once people start with Data Self, they don't have to start from scratch. Everything but they Have a lot. Now some people tell me, wow, that's a lot. Yes, it's a lot. Nobody needs 5,000 reports that represents from a starting point, nobody needs 5,000. True, nobody needs 5,000. But let me give you two examples of why we build and continue to expand this library. A few years ago, one prospect told me, no, Johnny, I don't need 5,000, I need 20, and I'm sure you don't have any of them. I said, you know, throw me one. And one of the reports he needed was a average moving sales by product in a four moving window. Well, we have that kind of report, but not for four months, only for three, six and 12 months. So he told me, you know, I told you that you wouldn't have it. And I said, yep, you're right, we don't have it. But in less than a minute, I took one of those reports for three months and I changed to four. I saved it and I said, well, now we have 5,001 and one of yours is ready. So the point is this 5,100 were inspired by clients asking us these questions, these unique questions that everyone has. And over time we built a lot. So many of our clients find what they need right off the bat or with a simple few changes, they can adapt to the specific needs so they can focus on analyzing data, not building from scratch. Everything. So very valuable. The other advantage of this comprehensive out of the box solution is usually when you install a BI solution, it takes some time for people to start thinking about it and getting value out of it. One of my clients, he also told me that he moved to a different business and he asked me, Johnny just installed the out of the box just as is. Because even though probably some of my data is not ready yet for analysis, I'm sure part of it is ready. And I cannot wait weeks or maybe even months for it to go through validation. Let me drive the process. Let me decide what's ready and what's not ready so I can tell you the IT and BI team what to focus next. So putting decision makers in the driver seats early on is critical. In the 5,000 can help them get in the driver's seat. Use it in a matter of hours. Once we install the product, it's really valuable. All right, let me just quickly launch a second poll before I start with the product presentation. So if you don't mind telling what are your main reporting areas. So just select all the options that you have and press the submit button. Ten more seconds. Don't forget to click the submit Button. Five more seconds. Thank you very much. Let me share. So the top is sales, second inventory, financial. Okay, thank you very much. Okay, so now I'm going to show you is actually the product. And what I'm going to show you is actually an example from one of our clients, a distribution company here in California where at the beginning of the process the CEO and the CIO they call me and make a long story short, the CEO told me, Johnny, my business is growing. We have a very data hungry management. We like to see data before we make decisions and it's getting too hard, you know, too often we have to either wait until the IT comes up with some new reports and dashboards to answer our questions or we have to wing it because we can't wait. Either way, waiting or winging, we can no longer live that way. We need a tool that empowers my management to make more informed decisions anytime, anywhere with an easy to use reporting platform. The CIO told me, johnny, we don't have a resource problem. I have a great IT staff, very competent, very effective. But it takes us a lot of our time to keep up with the management requests. It's frustrating for all of us and frankly my IT team has better things to do than building reports. We have to. But I wish we can automate a lot of these procedures and empower them, the users, so they can do more of these requests without calling us all the time. They asked me, can you help us? Absolutely. They have been using Data Cell for almost two years now. And what I'm going to show you now is actually how the CEO himself built a dashboard from scratch. He built several, but I'm going to show one of them in this dashboard. Before Data Self was taking many hours every month for his IT to put together. The CO takes these dashboards to board meetings monthly. And that's what I'm going to be creating is actually a dashboard for the board for the monthly board meeting. So let me switch gears here. And now I'm switching to the Data Self desktop tool which is powered by Tableau. A lot of the things I'm going to be showing you on the desktop can also be done using web browsers or mobile devices, maybe using a tablet like an iPad and do what I'm going to be doing here anyhow. So the CEO is going to build this dashboard that shows three areas of his revenues. One is detailed sales this month, then is showing marketing sales and then finally sales by geography, everything a dashboard. So when he came here to build this dashboard, the first thing he needs to do is decide which connector or data source is going to be building these reports. And here I'm going to show the connection data source available. We have available out of the box, ap, ar, CRM information, Google Analytics data, GL inventory, manufacturing, purchasing, budgeting, revenue, sales, sales order, US GDP data. Anyway, he just pick and choose. In this case he chose revenues. And now pretty much building reports and dashboards becomes a drag and drop kind of functionality. Very easy to do. So his first report was. And by the way, my sample database right now that I'm using has more than 30 million records. And the point is to show that even though I have a good sized sample database, my reports will run quickly and I have not optimized this demo for this database. This is just out of the box, out of this large sample database. Anyhow, so the CEO needs to see sales by customer this month, by product and invoice number. So what he needs to do is he comes to the dimensions and measures and just drag and drop. Here are my customers, I find customer name, drag and drop into my report. These are all customers. I want to see sales. I find sales, I drag and drop into the report. So this is total sales by customer in the whole company history. I want to see this in a descending order so I see my top customers at the top. So there it is, total sales by customer with the top customer at the top. Well, I want to see sales this month so I can take invoice, date, just drag and drop into my report. And now I see my whole company history, total sales by customer by year. Well, I want to see sales this month so I can expand year to go to the quarter level. I can expand quarter to go to the month level. And I could be drilling down into weeks, into fiscal periods, into days, into hours, minutes, seconds, whatever time period that you want to analyze. We just have to be sure. We mapped them in the data warehouse, plug them to this framework. And now users just have to expand easily, slice and dice it. It becomes very easy very fast. Now I have a lot of data here. I only want to see sales for this month. So let me filter it. I'm going to take invoice date and just drag and drop into my filter shelf. I can select different time buckets. I'm going to choose in this case relative date, very popular. I'm going to choose months. Click ok and there it is. Now this report will always show this month, whatever the month is. And if you want to change later, it's even easier. I come here and Say, hey, show me last month. There it is. Maybe I want to see the last three months, two months, maybe when I see quarters, years, weeks, you just point and click and you get to the answer. Very easy, very intuitive. All right, back to my month. Well, I want to see sales by customer, by product, invoice number, invoice date, you name it. If you know how to drag and drop, you can do it. So if you now add product, you come to the product list, you find the product description, drag and drop between customer and sales. There it is. Buy customer by product. I see my sales. Maybe you want to see invoice number. Just find the field invoice number is right here. Drag and drop and you get it. Many of my clients learned how to build reports from scratch by watching a presentation like this. If you know how to drag and drop, you can do it. Of course, there's a lot of techniques that take more time to learn, more experience, but the basics are very intuitive and there's a lot of online resources for people to also learn at their own pace. All right, that was the first report the CEO built, the next one, he wants to see sales, actual sales and website visitors side by side. They do a lot of website campaigns and they want to monitor how the website campaigns are affecting their sales in the long run. Before Data Self, this report was taking several hours of two people, a marketing and an IT person taking Google Analytics data, getting data out of the ERP copy and pasting Excel massage the data. It was a lot of work every time. With Data Self, we brought Google Analytics into the data warehouse. We blended website visitors with sales, linking by invoice, date and geography. You know, where is the click from, the country, the state, the location. And once we blend that information, the data warehouse, every day the data is automatically refreshed. What the CEO did was pretty much drag and drop. He actually double click sales and double click invoice date. So he sees sales over the years. He chose by month instead. So right now, just looking at ERP sales by month in the whole company history, website visitors is just another metric. It's just data. It's part of my sales analysis. The seal doesn't care how it was bolted into it. It was done, it was validated by it. Now decision makers just have to drag and drop. So he took website visitors drag and drop in the report. So these website visitors, he make a bar. So they are obviously different from the sales. He even put on a dual axis and there it is in a few clicks. He built his report from Scratch now completely automated. Something he was taking every month, two people, many hours to put together and now completely automated. The last part of the report of the dashboard was a geography analysis. He wants to see by state. So customer state could be shipped to anything that has a state. You can plot it. He want to see invoice sizes in sales. So he picked those three fields and he said show me this on a map. There it is on a map. Let's make it a little bigger. Let's make the bubbles a little bigger. So bigger bubbles, bigger sales and the bubbles are sliced by how large the deals are and that's it. In a few clicks he put it together. Now he built those three different reports and then he wants to put them together in a dashboard because he goes to these meetings using an iPad and then building dashboard is drag and drop. He drag and drop. The geography analysis, the trend analysis. He put it drag and drop at the bottom and the detail report top left. Just drag and drop. There it is in a few minutes from scratch. A dashboard that would take many hours, a lot of discussions for other people to build for him. Completely done when he goes to the board meetings. Now many of the board members, they also have mobile devices, notebooks and whatnot. So they can interact with the all by themselves. There's some old fashioned board members that still want paper, so it's okay. He also takes stacks of paper and hand to these people in some time. Some of these board members that don't have a mobile device, they say hey, I'm visiting some states. How are we doing over there? In the past, you know, the CEO would have probably may have to make notes and I'll get back to you today with his iPad he just opens this, let's say this dashboard. Select whatever states that he wants to take a look. It automatically changes to filter the whole dashboard for those states. Whatever the report is, he can quickly slice and dice it. He prints this information into a PDF file and emails to the board member and what's the next question? So make a long story short, those initial challenges they told me about now it is so happy because more than 80% of the time they were spending with reports before data self have been completely automated. So it has been freed to do more IT job and do more sophisticated work. So a lot of more free time to more important IT job. The CEO told me that they're so happy because more often than not now decision makers can access the reports and dashboards anytime, anywhere. They can open them, they can slice and dice them, they can create new reports from scratch without calling for it. So very empowering, very intuitive, very fast. Now how many people consume data? They usually go to, let's say to a web browser or mobile device. They log to the portal. They have a portal and they actually log to the portal through the Internet. So they just log to the portal is on the open Internet, it's very secured. When they log into this portal, the tool knows who they are and only gives them access to their own reports and dashboards. So the CEO has his own project that has its own top level reports and dashboards. Salespeople have reports and dashboard that look at opportunities and sales and sales orders. People from the finance team have GL and some other reports. Now when a user opens a report, let's say a sales report. Suppose I'm the VP of sales and I open this top customer by sales change since last year today report which by the way is out of the box showing top growth and decline since last year to date. If I'm the VP of sales I see the top growth decline across all territories, just the top customers by sales change. On the other hand, when the let's say the rep for California opens exactly the same dashboard, this person only views the top growth decline in California. So it uses security by row. Every person has only access to a certain number of reports and dashboards. And within each dashboard report they can only see information that they have granted rights to. So very intuitive, very fast, very easy to access in how people consume data again through desktop web mobile devices. Sometimes you know, people don't want to go to the portal to access. They will actually want to receive information automatically somehow so they can say hey, I want to receive this dashboard. They can click here, subscribe, show me this dashboard. Send me this dashboard automatically every Friday 4pm subscribe. There it is. I don't need to go to the portal. The report will come to me on a schedule basis. Very easy self service. I choose which ones I want to receive or which ones I don't want to receive and there you go. We also have a new functionality called the alerts. Alerts is another way that people are using to consume data which is when something goes over or below a certain threshold, send me an email. I don't care if it doesn't go above or below. I only care if it goes above or below a certain threshold. Most and actually probably all other alert tools I know the mid market are very IT driven. Decision makers have to tell it, change this, change the, change the parameter, create a new one this is very self service. Let me give an example. Suppose I want to create an alert for this particular, you know, dashboard. When gross Profit goes above 55% I want to receive an alert, an email. I can come here, I click gross profit, you know this axis. I click alert right here. I can select in what condition the alert is going to happen above, below, so forth is going to be, let's say you know, above 0.6. Whatever it is, you just pick and choose and at the bottom behind you see where the line is being set. You give a subject to the mail. You define how often you want to receive, only once, you click Create alert and that's it. Now every time that this alert goes above the threshold, I will receive an email like this, completely automatic, completely self service. And let's say I received this alert now in my inbox and I come here and I see what's going on and maybe hey, I don't want to be more part of this alert. I can decide and I can remove myself. Or maybe I forward this alert to another person and that person gets the alert. Oh my God, I need to be part of this alert. That person can just click add me to the alert and it becomes part of the alert. They must have a license but they can choose to be added to the alert. Or let's say hey, I want to change the threshold. I just click in my email, added this alert, the tool goes right into that particular alert and just I select I want to go to 58 and I edit very self service. Business people are the ones who want who knows the threats and opportunities. They need to be able to set up their own alerts and maintain them if they choose to. So this can be done by the users or it can also be done by it. Alrighty, so that was a quick overview. Let me just move forward here. So in a nutshell, why people choose data self analytics, There are three main reasons. The first one is in the mid market we are pretty much the only vendor that provides a top ranked enterprise graduate enterprise grade BI solution that is ready to go out of the box. Top notch is not perfect, it's not a magic wand but boy is one of the best out there. Second, you don't have to start from scratch. Your BI project there is more than 5,000 reports APIs with a lot of connectors to a lot of different data sources that are very popular in the mid market. So expediting significantly the time that it takes to get value from your bi. Third is if you need a more structured BI journey with data warehousing with a more sophisticated analytics platform. And if you chose our framework, we have expertise. We do this every day in, day out and we can complement your services, we can train your team, we can be outsourcing here and in the future when you need it. Count on us. We have the expertise to get the job done. So my last poll is what would you like to do next? So let me just open very quickly. So if you don't mind, please check the boxes that make sense and click the submit button. Ten more seconds. Don't forget to click the submit button. Five more seconds. All right, thank you very much. So I'm going to open the Q and A session. If you have questions, Please use the GoToWebinar panel. There is a chat box so click your questions and I'm gonna check if there's any questions already. So there's questions here from jcpinzen. Any specifics you can share regarding Data self and using it with Sage products? JC, thank you for a question. Let me just switch gears here to give you some information so you can go back in case you need. If you go back to dataself.com, go to Solutions and choose analytics by ERP and CRM. You'll find on this page all the ERP and CRM systems that we have. Connect us out of the box and we cover a lot of the Sage systems. So all of these Sage systems we have more than 5,000 reports, APIs covering AP, AR financials, inventory, purchasing, sales, sales order services and things of that nature. Jc, thanks for your question. Let me see more questions. Question from Michael what is typical installation cost for a 15 user environment, including tableau? Michael, thank you for your question. I cannot give you pricing a ballpark figure here, but I'll email it to you. What I can tell you though is if you do have the need for a enterprise grade platform with data warehousing and taboo kind of functionality, and if you look at how much you're going to be investing in this project, do it yourself. Hire a consulting company to do it, or with dataself, if you compare the options, what I can guarantee you is our approach will give you a lot more value, a lot more quickly with a lot less money of investment because you don't have to start from scratch, you don't have to learn all the pieces, you don't have to connect the pieces. And we have 5,000 as a starting point. Maybe only a fraction will work for you, maybe 1,500, whatever the number is, but it's a lot. So I will contact you later to discuss in more detail. But I can guarantee you that once we are a good fit for a client. Boy, we're so excited. We are very good at what you do. We are the best in my opinion. There's no one better doing what we do. We're affordable, we don't break the bank. Yes, we charge what's worth it, but from an investment standpoint we usually are afresh of the cost because we know what we're doing, we know the data sources and we have the out of the box solution. So I'll talk with you in more detail to discuss your specific needs. Michael, thank you for your question. Let's see more questions here. So question from Ron. Where can I learn more about the 5000 KPIs? Ron, thanks for your question. Let me go back to my website here and if you come to the solutions menu, where is it here? Solutions menu and you choose 5000 KPI's. So you go to this other website other page that has a little description and summary of what the out of the box solution is. If you click download full list you'll get an Excel file that has the complete list of all the names of all reports and dashboards included. So I highly recommend you to take in this Excel file and let's say suppose you choose sales, you come here. Here you can see a more detailed example of how the tableau connector looks in all the pre configured sections or pieces of information available out of the box. And if you come here you can start seeing the actual name of reports and dashboards and see all a lot of the details. So recommend taking a look at this also click this dashboard samples button that you actually go to this other website here other page that shows example of how the dashboards look. Absolutely feel free to contact me to discuss in more detail. My main goal is usually education give you the options. Even if data set is not a good fit, someone else is. I'll be glad to tell you where you should go where I believe you'll be more successful. And if Data Self is the right option I'll be super excited because again we know what we're doing, we're very efficient and we're very affordable. Folks, we're running out of time so let me just wrap it. If you want to discuss more details about data self, about your bi options, competitors, pricing, time it takes to deploy and whatnot, feel free to contact me. Here's my cell phone and my email Again. My main goal is education. I appreciate your time today. I hope you found some value in this session. Feel free to give me a call later. And by the way, this is being recorded. I will make it available by tomorrow the recording with you. Feel free to share it with your peers and I hope you have a happy hump day. Thank you folks.










