DataSelf Data Warehouse Overview
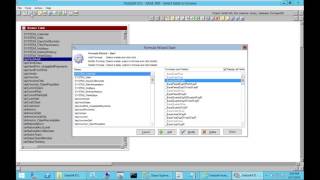
A walkthrough of DataSelf's ETL framework using Sage 500. Learn to browse tables and metadata, import new fields and tables, build indexes and formulas, set up automated refreshes like daily 1am jobs, and use underscore views to keep reports stable when source systems change.
Chapters
This video, it's an overview of the Dataself data warehouse framework, focusing mostly on dataself vtl, our extraction, transformation and loading tool. So let's start by opening dataself etl. I'm going to go here and open Data Self. I can have several ETL projects. In this case, I'm opening for this demonstration the project called Sage 500. This project is an example of an out of the box solution in this case for Sage 500. And the project is written right here. I'm currently connected to the SQL Server, to the SQL instance that is the local instance, and I'm working with a data warehouse called DW Sage 500. So when I open this Sage 500 project, it shows me what tables are available in our box. Data warehouse for Sage 500. So these are the tables in the browse table dialog. Typically we have dozens, sometimes even hundreds of tables pre mapped out of the box. If you want to learn more about the metadata of these tables, you can expand this browse table. This is the table name in the data warehouse. This is the data source that we're using to pull data from the source table. In this case, the source table has the same name as the data warehouse table. It tells when was the last refresh. And we can also see other fields such as when the table was created and several other information telling how the table is refreshed, if there's a table union, if there's a filter and whatnot. So very detailed metadata right here in this browse table information. Now what if you want to open a table and see its content, you know, see the fields in data, you can just double click the table. Say I'm going to double click TAR Customer. So this opens the TAR Customer table. It shows me fields and the actual data available in the data warehouse. If I right click and I choose fields, it will list all the fields available on the data warehouse table. And here we have black fields and green fields. What about them? The black. Let's open this Fields metadata. The black fields, they are fields pulled directly from the source table. So you know, we pull data from the source table called TAR Customer. And these source field names come straight from the source table. And here we have the field format, the field size and some additional metadata as well here. Now what are the green fields? The green fields, they are derived fields or calculated fields built exclusively in the data warehouse. So if I bring this field here, for instance, so this is a green field, and if I press and hold shift and click on the field name, it Tells me what this formula is about. So this field actually is all trimmed Customer ID plus three spaces and customer name. So there are usually hundreds of calculated fields in the data warehouse to make reporting easier. Now typically people ask us how can we add a field to an existing table in the data warehouse? That's a fairly straightforward procedure. So let's do that. Suppose I want to add the credit limit age category to my TAR customer table. How can I do that? It's not out of the box. If I open the list of fields here, I don't see the credit limit age, I only see the credit limit. So I want to add a new field available in the source table but not in the data warehouse. Let's do that. So I'm going to right click on the table and choose Modify import mapping. So when I do that, the wizard will already point to the source table that's coming from the source system. And this is defined by using the data source called DSH500 and it goes straight to the torque customer table, which is the source table. Then on the next tab it step it tells me which fields have been already selected out of the box, in which fields we have not added yet. Why don't we add all fields out of the box? Make a long story short, because in the long run if you're adding fields you don't need for reporting, that will add trouble overhead. The refresh is going to be slower, backups will be bigger and long term maintenance can be of a headache. So we recommend only bring fields that you need for reporting because it's so easy and straightforward to add more fields that is required like I'm doing right now. So if I need to add the credit limit age category, here's the field that is not available yet, I'm going to click add to the right. I could add other fields, as many as I want, go to finish and I can import later. If this table is too big, I don't want to wait. Or I can import now if the table is not too big, I'm going to click import now because this table is actually not big. Importing the records. At the end it asks me if I want to recalculate related formulas from other tables. I don't want to do that right now. So right now it's going through and recalculating all the formulas or derived fields available in the Tor customer table automatically. The ETL will just go to the process of getting the whole table recalculated at the end of the formula recalculation it recalculate indexes associated to this table and that's it. Now if I open the customer table again and I open the fields, I see now the credit limit age category which is right here. So very quickly, in a very straightforward manner, I was able to add a new field to an existing table. So fairly straightforward procedure. Now what if we need to add a whole new table to the data warehouse? How easy is that? Let's do it. If I want to add a new table, I go to this button which is the import table wizard. It tells me which data sources I want to use. Typically this is set up at the beginning of the system. You can easily create new data sources. In my case, I'm going to open or I'm going to import a new table from the Sage 500 data source. So I click next, I type the table name. In my example, I want to add the tap vendor address. So tap vendor. I go straight to the tap vendor section and I'm going to add this tap vendor address table. So click next. It selected all fields. I don't want to add all fields. I just want the address key and let's say the vendor key. Suppose I just need those two fields for this table. Then I go finish. I'm going to import it now. So right now I'm just importing a new table with two fields and hopefully all the records will come in. So here's the new table. I'm sorry, this is one, the address. I open it up and I see all the fields created and populated with data. Very cool, huh? Now typically when import a new table, I need to create indexes, formulas, filters and whatnot. Let me create some indexes. So when I click this button to create indexes for this new table, I'm going to create this new index which is the address key. And then I'm going to create the vendor key, also being an address key. I'm sorry, an index. I could do stacked indexes. I can make different things, primary keys and whatnot. But right now I just created a new index and it's showing my table. What if I need also to create a formula, let's say to sum in those two fields together. So let's say I want to create a new formula, a derived formula in the data warehouse that would add this field plus this field. How can I do it? Well, we can use the formula wizard with this button here I go to the table and I define a new formula. I define the type in this case is an integer. Click add. In my example, I'M going to add those two fields. Just add them together and save them. And I call just a combination of both. That's the new field name or the new formula name and then click ok. So I just created a new derived field. Let's ask it to calculate. So right now it's calculating and when we open the table, voila, we create a new formula that adds this plus this. This formula could be character, could be many kind of transformation. You just do it, it becomes part of the data warehouse. Now, every time that we refresh this table, this formula will be also automatically calculated. So the next question is how to refresh the system. Well, we can simply come here and tell the system to refresh this formula manually. Right now it's doing this procedure manually. Or I can go to the refresh wizard button and the refresh wizard is where you tell how the data warehouse will be refreshed on an automatic basis. You can have several batches. Each batch can have a different schedule. Typically we have batch zero, which is the main refresh. And for this batch or any batch, you can define several steps where you can refresh different buckets of tables. And once you build this configuration, you can come here to the properties. And then you can tell to the system to create a SQL Server job to refresh this particular batch, let's say daily, once per day, starting at 1am, you click apply. And now this will create or will maintain in the SQL Server a job that will run this refresh automatically. In this case every day at 1am and that's it. So by the way, we just added this tap vendor address table and when we went added manually, we didn't tell the system when to refresh. Well, I'm going to add to the Batch 0 first step, I'm going to add this table here and click save. And that's it. Now moving forward, every day at 1am the whole system is going to refresh, including the new table. And that's completely automatic and completely hands off, I would say once you have the system set up. Now, there are several other features available, but this is just an overview of the main piece that typically people ask us how they work. Now, how does the data warehouse look if you go to SQL Server Management Studio? In this case I'm connected to the DWCH 500 and I'm looking at the views here we have at the bottom the tables and we call in this case the views that are maintained by the etl. And the top we have what we call the underscore views The Underscore Views is a way we found out to isolate the source database structure from reports. Our recommendation is that all reports pull data from underscore views, not directly from the tables and field names that are connected to the source system. Why? Well, because over time the source system will change. Tables will be split into different tables. Fields might change the names. There are so many changes that source systems go through. And if you connect your reporting tool directly to the source tables, every time that those changes happen to the source, you have to remap all your reports. Or if you're using Tableau or some other analytics platform, it takes a lot of effort to remap them. When you use the underscore views, like in this case, all our reports that are connected to sales, Tableau reports, even Excel reports, they go straight to this DSA Sales. Let me show what we have here. It has a bunch of tables linked behind the scenes. At the end of the day, what the reporting tool sees is either these aliases or these that have information coming from all over the place. What happens is when there's a change in the data structure in the source system, we just come to this Underscore view, we remap the fields, and at the end of the day, the reporting tools, such as Tableau, for instance, will not see the changes because we take care of the remapping at the Underscore views. I hope you have found this video informative. If you have more questions, if you want to discuss our data warehouse framework in any other piece of our solution, just contact us. We'll be glad to provide you for the information. Thank you very much for your time.










