DataSelf ETL+ Launch
Johnny Girardi launches DataSelf ETL+, a Windows-based tool that pulls data from multiple sources into a single warehouse. The product covers about 80% of common integration needs out of the box, deploys to AWS in five steps, and includes Tableau-backed analytics with natural-language search.
Questions this video answers
October 22, 2020.
$299 per month.
Supported today: Tableau and Excel; Power BI support planned/coming soon.
Includes 10 users (starter plan).
Initial release is a Windows-based application (web/app planned later).
Chapters
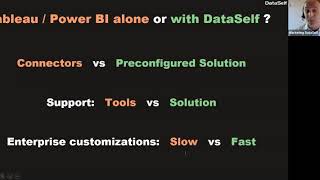
Alrighty, everyone. Thanks for joining us. My name is Johnny Girardi. I'm a data Sales founder and CEO. I hope you're staying safe, well and sane if you live here in the U.S. some good news. In about one month, the wet season will be back. So we in the west coast will be out of the fire season, thank God on the east coast, out of the hurricane season, thank God. In elections will be behind us. So we'll have a lot more energy to focus in our lives to move things forward. So today we are super excited. We're launching ETL Plus. It's a dream coming true for us and also for our resellers and clients in the market. I want to jump right into it, so let me move things along. What I'm going to spend the next about 45 minutes is talk about, first of all, what is the vision, the new things we're coming up with? I'm going to spend some good time showing the product, how to deploy it, which is very quick, how to use it, how to maintain it. In a little bit about legacy data migration. I'll talk about product roadmap, I'll talk about pricing. And then we're going to open a Q and A session. If you do have questions, you're all muted for this webinar. Please use the Zoom panel to enter your questions throughout the presentation and at the end we'll take care of them. But first I would like to open a poll to ask you a question, which is what BI tools you're currently using. So let me choose here, BI tools. So please vote what tools you are using. And I'm going to make this very quick. I'm seeing a lot of results coming in. Five more seconds. Two more seconds. All right, still a lot of answers coming in and we're going to wait two more seconds. All right, good. Let me share the results. So Excel dominant, which is common crystal. Second, a lot of other tools. So thanks for sharing it. Let's move along. So what is the opportunity that here at Data Self we're looking at? We are data geeks and we see that companies out there have lots of data. You're capturing a lot of data from your business just to give some ideas of what systems we're talking about. You have your ERP system, your CRM, probably, probably spreadsheets, a lot of spreadsheets. You might have a manufacturing system, E Commerce. I mean, there is a lot of systems out there that people use to run a business. And I'm just kind of popping up some of Them that we have seen our clients use. Usually there are more than 20, sometimes more than 40 different systems that companies use to manage their business. And we at Data Self use more than 20. So it is a little bit of a hell the amount of data silos out there. And as a decision maker you want to see information sometimes across these data silos and it is challenging. So what problems do we see out of this wild wild west of data sources? First of all, every system, every data silo has its own login. So you need to know how to log in and sometimes you don't, you don't remember what is a password. And if you want to see some reports, some data, sometimes you don't know where to go, where the reports are. So every data seller typically has its own reporting tool with its own credentials. You have to know everything about it, you know a little bit about it to find the information. Second, if you cannot find the report that you want or if you need a new report, typically each data silo has its own report expert, a person sometimes in the company or outside that knows that system. You have to contact this person to ask questions and wait. So the people that know the systems is another major problem in reporting then sometimes the answer that you're looking for is between silos and now sometimes you have to contact several peoples to get to the inside that you need. So very challenging when the data is between the silos. And finally is I don't know what I don't know. People are busy and sometimes they don't look at certain trends and metrics and KPIs that are so critical but they are busy to even think about and they don't know and they are missing opportunities or missing threats. So these are the high level problems we tackle for reporting. So now I want to run another quick poll just asking what are your main reporting challenges and please check all that applies and press submit. I'm seeing a lot of results coming in. Still pretty active. Five more seconds, three more seconds. All right, thank you. Let me share the results. So complexity is the biggest one. Time consuming access anytime, anywhere in Excel hell. You know I see a lot of people telling Excel hell, not a lot in this audience but anyway, thank you for sharing. Moving along. So what is the data self vision to tackle those problems? What about the reporting tool? Every system has its own reporting tool. So data self vision is to become one reporting platform or solution to work at across all the data silos that you care from a reporting standpoint so you don't have to have different credentials, you don't need to learn how to use. You go to a single place that everything is there. That's one part of solving this problem. Second, what about the report experts? Well, we focus a lot of our energy, we're data geeks to build an out of the box solution that covers the 80% of the needs that you have. We've been doing this for 15 years. We ask what our clients need and as we see the common reports being asked over and over and over, we build out of the box reports and mappings to those components. So let's say if you want to see your Google Analytics data and you know you don't want to get into data itself, the idea is that 80% of what people want to see out of Google Analytics, you'll find out of the box on day one in data Self and you don't need to know anything about Google Analytics except giving the credentials to access your data. All the pipeline, pulling the data will be done by data self and then we will be training you, your resources, whoever is maintaining your solution. So these people can easily go to our mapping solution. And if you need to bring something new from your data source like Google Analytics, this person will open a wizard, see what tables and fields are available. They just pick and choose and that's usually a lot of the customer reporting work, just bringing new fields and tables available from the data source. So that's how we're going to be helping you or your people who maintain your system to support several data silos across your organization without being a super duper expert in spending weeks and months to build your reporting platform. What about when the answers are between the silos? Well, we use data warehousing. We'll be hosting or bringing your data together into the data warehouse, securely consolidated. So the data is all there, the answers will be in the data warehouse and will help you make decisions more quickly. Finally, I'm going to give a very quick example. One of our clients. When we deploy our data self solution, they ask for very complex commission reporting that took months overall to figure out and completely automated after they completed. After completing this process, the CFO was happy. And then a week later he called me back and he told me, johnny, you know, I saw an out of the box report that was ready months ago. If I had seen this report on day one of the deployment, I would have told you, forget commission calculation. It's a problem we have, we've been managing painfully, but we have bigger fish to fry you out of the box. Show us A major issue in our inventory processes that nobody knew. So sometimes what you don't know is as important or more important than what you think you know and out of the box. This whole solution that we're talking about is being crowdsourced. Crowdsource. KPI's hope is going to help you to see more metrics and keep your business really effective. So that's our vision, that's what we're working to accomplish. The technology overall, you have on the far left the data sources right now. These are the data sources that we already have either completed the mapping using the new ETL or we are about to finish. So if you have any of these data sources we already can cover. ETL plus right now initially is a Windows based application, but in the future it's going to be completely web based as well. So you don't need to be installing things on computers. At the end of the day, the ETL plus bring data to a data warehouse. Super simple, super easy, yet extremely powerful. You can really make a lot of changes and it simplifies the data feed into tools like Power bi, Tableau and Excel. Today we're supporting Tableau heavily in Excel and Power bi. We are about to launch those additional components. So if you work with any of these tools, we make the process much easier. The good news also pricing starts at 299 per month. Now some people ask us I'm already used Tableau, Power bi. Why would I need Data Self? These tools are amazing. It's a great question. When people ask me this question they call me hey Johnny, you already have Tableau, Power bi. Why I need Data Self and I ask them why are you calling me? Primarily the issues are this. Tableau and Power BI give you connectors. Hey, this is a connector to your salesforce, to your acumatica, to your sage 300, whatever. Good luck building the rest. If you have time and expertise, you'll do it. It's going to take a while. Data Self out of the box has a complete pre configured solutions, mapping a lot of the tables, linking them together and giving reports on day one. So you have a lot more than a blank sheet. So that's one of the biggest value. Second is when you run into issues with those tools where you find the answer. You get support a lot of support online but it's about the tool functionality. We our support either our people in our documentation is around the solution. We look at the data source, we look at the data preparation data warehouse, we look at the reports and dashboards. They're all connected so you can focus on quickly getting the information out and not figuring so many things from scratch. Third, enterprise customizations, when you start embracing these tools at the beginning is quick and easy so you can get some win result, some quick results quickly. You know, usually the first five, ten, maybe a few dozen reports and dashboards in these solutions alone you can do it quickly, but when you wind up go up across different departments, different data sources, it gets really slow, typically months if not years to get these two solutions from scratch. Covering the organization more broadly with Data Self. Because of the out of the box solution covering so many different silos, typically in minutes, you can have a solution that has 80% of what your company likely wants to see out of the solution. 80% is out of the box or a few clicks away from the out of the box. So that's why going with Data Self is more efficient. What about the reporting tools in the systems versus Data Self? Are you going to be getting rid of those reporting tools in the data sources? Absolutely not. Those tools were designed to be process oriented reporting. So people working every day into those tools typically will see value in those reporting tools because they are in the tool all the time and they are live with dataself pretty much we're taking care of the analytics slice and dicing easy ways to analyze your data historical. We can run reports very quickly and if you need to go corporate wide, you know, share reports with other people across different data silos, Data Self is the way to go. So we complement those reporting tools making that kind of value. This question actually my marketing insisted in me asking, so I'm going to ask anyway, what is an ETL tool? I'm going to give it 10 seconds to answer. Five seconds. Finally, someone voted. For what? I was hoping someone would vote yes. ETL is extract transforming load and thank God someone said it's part of the extraterrestrial technology layer. That's where we're going to thank you for sharing. All right, so it's a tool to bring data from different data silos, make it easy, make it fast, using data warehousing so all your data silos becomes part of your single version of the truth. And now we are into the demo so I'm going to show a few things. I'm going to show the deployment, the out of the box how to customize in legacy data migration. If you have seen the Data Self demos, the out of the box demo, you probably going to be seeing things over again. But I encourage you to stick around because there's Some lot of good news in this next 20 minutes or so. So first of all, deployment of Data Self. How do you go about deployment? So let me show you that you go to dataself.com you click the logo of the product that you want to deploy Data Self. Let's say Acumatica. So click Akumatica. You go to this page that has a bunch of information about the Data Self solution, videos and whatnot. You can see pricing, so you scroll down, you can see pricing as well by users, by modules and whatnot. And if you decided to move forward, you CL deploy analytics now and follow this form. So it's pretty much filling out a form. Once you complete that part of the process and you go to the actual deployment of the ETL plus. And again, ETL plus today is a Windows based application. There are primarily five steps to go through to deploy. Out of the box you enter the product registration, we secure the IP address where you are. We're very paranoid with security and privacy so we do a tunnel between your IP address in our cloud in aws. By the way, the first release of ETL plus only works with our cloud system. In the future we're going to also have on premises deployment. But anyhow, so we secure your IP automatically. You just confirm, yes, that's my ip. Do you have a second ip? Sure. Add a second ip, you create a new user, you connect to your Data. If it's SQL, there's going to be a SQL server connection. If it's OData, it's OData. If it's ODBC, you put an ODBC but you enter the credentials. So you have to be a little bit technical to know the credentials here. Then you schedule when do you want to refresh the the data extraction automatically. Then you press finish. You know, if you trust the data self out the box, it takes pretty much five steps to complete. You can do this in five minutes literally out of the box. You get this whole system but usually tell people takes 30 minutes to read documentation, check the credentials and whatnot. But overall it's a five step process. You have to make decisions to deploy Data Self. There's a lot more I'm going to be showing. What else can you do with the ETL plus But the out of the box deployment is this easy. Now what do you get out of the box? I'm going to show you now the out of the box solution. What I'm going to be showing you is part of the vision in part of what we have today. Now Once you have deployed the Data self ETL and it has crunched your data, you receive an email telling your system has been deployed your data, your initial data upload has been completed. You know it can take minutes and hours depending how much data you have in your Internet connection or the Internet connection to our cloud. So it can take hours. But once this is completed, you get an email that will give you congratulations. Here are your credentials to your Data self analytics portal. And then you go to that analytics portal, you enter your credentials, highly secured and you'll see something like this. You get to the homepage where you can see your different data silos or divisions. You know your ship sales, inventory management, your financials, pipeline, marketing and right now out of the box we're not covering all of these components. About half of this component that I'm showing this screen is part of our future releases. But the idea is as you wanted to bring more data sources to data self, they'll be in something like this. If you have access to everything, you just have to point and click and see the other box. If you're only dealing with sales, maybe you would only have sales in some of this pipeline and marketing. If you are dealing with inventory management, maybe you see sales in some of these inventory management. If you're only manufacturing, if you are payroll, payroll is usually super duper critical as well as financials, you would only have access to certain segments. But the point is whoever have rights to different data silos, they would have a starting point like this where the reports and dashboards are. Now I'm going to show about five different of this out of the box that are available today if you deploy out of your ERP systems. And then we're going to show you also where you go next in case you want to learn more. So let me show some examples of my out of the box reports and dashboards. I'm going to start with the year over year sales. By the way I clicked too fast. So let me go back to that one. I just want to show I am the shipped sales your invoices and click the year over year sales. This dashboard is super popular in our client base. One of the most popular out of the box. It shows you the total this year, total last year, the variance, and you can easily select the year in the periods that you're looking at. So right now in my sample database, this year which is the dark blue goes through month six. What if I want to see a year to date analysis? So I just uncheck the periods, you know just leave 1 through 6, press apply. Now this dashboard is showing my year to date sales and I'm growing about 10% in this example. Hey, look at this. Customer actually is declining a lot. Why I can select the customer and now the whole dashboard changes to show the total for this customer. Trend analysis, what I'm shipping to and what products are driving the decline. Very interactive dashboards. Point and click and you can see results very quickly. So that's one of the reports out of the box. What if you want to see my code performers, what are code performers in our definition out of the box? Code performers can be your customers, can be your products, can be your salespeople. You can just choose who what the performer is. In this case, I chose customers and it shows in a given period. So I have period one and period two. I can enter any period here. In this case, these are my customers cooling off, meaning they have the biggest sales decline between those two periods. And these customers are frozen. Frozen mean they were buying last period, but not at all here. So they're no longer buying out of the box. This is a kind of dashboard that is also available for your sales analysis. I want to show one more for sales, which is the Pareto chart. That in some businesses is a very good perspective. Here again, I'm choosing some kind of dimension and analyzing this case. Customers could be any of these. This is my gross profit by customer in a descending order. The ones in blue, they represent 80% of the profit. The ones in red are the 20% of my profit. And here I see sales. And the question is why some customers with big sales, they have so little profitability. And why some customers with small sales, they have high profitability. Sometimes this kind of question can highlight some trends in your business that you might not be aware of. So you can focus your energy in where you make the biggest bang for the buck. And the last one I'm going to show very quickly is the loyalty. You know, we have a lot of reports and dashboards looking at sales analysis. Now let me also show some financials. I'm going to show the AR receivables For companies who have a lot of receivables. This is a very easy way for managers to see where the problems are. So total balancing on open receivables by payment past due, where the money is coming from. This is by due date. This is to date. All the colors follow this standard. So green means this on time, by salesperson, by customer in the details. And look at this. Wow, this customer has a lot of Old invoices. What about it? If I click the customer, I go right into it to see all the details. Very interactive. I'm going to show a financials dashboard and then I'll get out of the out of the box. Financials dashboards, P and L kind of things. We have a lot of power here as well and they're highly interactive. Everything that I showed you so far is available out of the box. If you go with an ERP connector for the systems that I showed before this will be available after 30 minutes of deployment and after we load your data. So very impressive. Now all good. Out of the box again. 80% of the reports that you need to run a business should be covered with the out of the box. That's our vision. We're still working on it, but that's our vision. But you have custom needs. How does it work to customize the out of the box? The first thing I want to show when customizing the out of the box is who should be doing the customization. Let me go back to my main panel here. Who can create queries to get information out of the system? The first thing I want to show is the part that anyone that has access to data self can do, which is called natural language query. And I'm clicking on the natural language query tab. Natural language query is like searching the Internet like Google or Bing. But your data source is not the Internet is your actual data silos. And the answer to your question is not a blog, it's not an article, It's a report built into instantly and accurately. Let me show some example. So by the way, I was in the ship sales, so I am in that department. Let's say I'm the VP of sales and I click natural language query and I go to natural language query and I ask a question. Let's say I want to see sales by salesperson in 2020. So I asked a question. The tool uses natural language in artificial intelligence to understand the question Give me hits. Just like on an Internet search. I select the right hit in the tool builds instantly accurately. The report in this example by salesperson is showing sales in a descending order in 2020. It looks like magic. It's not magic, it's technology. And what if I want to break down by month? I type by month again the tool will give me options or hits. I select one of them, the right one and the tool now shows me by in 2020 by month by salesperson. My sales as a line chart. Instant accurate answer. Maybe I'm not a chart person. I want to see a table like in Excel. Sure, I can select tax table and now the tool converts that to numbers by the penny. And if I like numbers by the penny, that's easy. Natural language query is fairly new. It's about five years old technology that's kind of new. It's very empowering but still doesn't answer all the questions. You'll still need the consultants or the expert to do a lot more. But this tool allows business people with no training to find answers to their questions and easily Export maybe I want to see my generous sales. I'm going to select generous sales and I want to export this data, let's say into Excel. Sure, I'm going to I selected the data points, I click view data, it gave me those specific data points. But I want to see the full data mean all the underlying data behind that data point. And now it came into Excel and now this would be all the data points behind my generous sales by salesperson. So very easy to find data using natural language, export to Excel and make decisions. So this first part is straightforward natural language anyone could do. But again, the reports and dashboard that I showed you so far they are more elaborate than natural language and you still need the expert to be the expert to do more elaborate reports and dashboards. What I'm going to show you now is diving into the customizations in data Self that require more expertise and I'm going to go at the point where I'm going to go back into the ETL and show how it works. So we're getting, for those of you who are more technical, we're getting there. Now the first part is still pretty straightforward. Now I am in the report editor and I'm using the report editor embedded in data self using Tableau as the engine behind the scenes. When we release the Power BI integration it works about the same thing. Overall the good news is if you know how to drag and drop, you can pretty much get the answer just by dragging and dropping into the report. And now when I'm going to go through this exercise, I want to make a real case scenario where a person like me, a decision maker, knows the basic where I can build this simple reports and dashboards. Not simple, but I can easily build reports and dashboards using this report editor. But I'll run into issues. I need some data that is not available pre configured in the data self system and I'm going to show how we can solve that problem on the fly. By the way, now that I'm switching to this part of the demo. My sample database is different than before. If you know sample databases, probably you could recognize we're using some sample databases from one system. Now we're going to go into another database. Do not worry about the data, just focus on the process. So back to my demo. I'm putting my hat of the VP of sales and I want to build a new report from a new dashboard from scratch. I want to see sales by customer, by national account. So I sell to big, to Walmart, to Target, But I also sell to a lot of small retailers and I want to see my national accounts, my individual accounts. When I see sales by year and I want to see sales by territory. I want to put this on a dashboard that my team can easily interact with. This dashboard is not available out of the box, but I know how to do it. So I log to data self report editor as. As the report editor, I have this power. This is a user security thing. If I can or I cannot edit reports and I go into my sales information and I'm going to start building the first report. I want to see sales by national account, by customer, by year. When I go to my sales, here's a customer and I do not see the national account. Hmm. Well, let me first just build sales by customer by year and then let me think about the natural account problem. I see customer here, so I drag customer to my rows. So these are my customers. My sample database is very small. Again, just showing the example. This is my customers. I want to see sales, so I bring sales to my report, total sales by customer and want to see by year. So this report was easy. I just dragged and dropped customer sales document date and the report is ready. But I need national accounts and I cannot find it here. Well, I'm not in my example. I'm the VP of sales. I can do this because I can read these things. But tables, table names, how to link them. Thank God I'm busy. I don't want to learn that. I have my ERP consultant. Could be someone inside of my organization, the report editor, the business analyst, or could be a reseller that does this back end thing. And well, I cannot find national account. I'm going to be calling Taylor, which is my support right now and let's see if I can call Taylor. Taylor, are you there?
I'm here, Taylor.
All right, well, I'm trying to build a report here out of my sales to show national accounts, customers and sales. And I cannot find my national accounts in my data self. Can you help me?
Yeah, national account doesn't come out of the box, but I can totally add that for you. So I'm actually off site right now, but I can log in to the ETL plus and get that added right now. So let's see here.
All right, I appreciate that.
So I've logged into your ETL plus here and I see that you want to add it to the essay sales data source. So let me just add national account.
That looks like CRIC to me, by the way.
So perfect. So you can see here that I added national account and this is how it's going to come over. So I'm going to confirm that and save once I save it. Since I'm off site right now, I don't have the ability to refresh. But you as the user will have a shortcut on your dashboard to refresh this data. So you can either refresh it now or wait to the schedule runs overnight and you'll get that field in the morning.
What you're saying is that you added somehow with your magic wand this national account field that I cannot understand. But I see what you did and either I wait until tomorrow to get national account or I can run through my. You mentioned a shortcut in my desktop, is that right? It is.
So you have a shortcut that you can refresh your data now.
Okay, getting back to control here. I'm going to see if I can share my screen and show to the folks how would be the next step here. All right, so I'm back to my. Can you see it by the way?
I can.
All right, so I went back to my. Let me go back to my desktop. Oh, look at that. There's an icon. Refresh my ETL plus. Amazing. I didn't know you have this icon here. My desktop is full of icons, but of course this is a little demo. By the way, the ability to refresh the data self system is something that you don't want to give a user like me to run it because that can be dangerous. But in my case, looks like Taylor. Trust me. So I'm going to double click this icon and let me just. It should be refreshing now. There it is. You give this message, there's going to be refreshing my data. There's some options to refresh everything or not. I don't know what's going on, but apparently it's doing its magic. By the way, I'll be receiving an email when the refresh is complete. Usually in a production server, this takes only a few minutes. No matter how much data you have, the refresh process is optimized. So I'm waiting here to receive the email and apparently I received it. Okay, so Taylor, sounds like I got the email. The system said it's ready, but I'm back to my report here and I still don't see national account. So something went wrong.
So nothing went wrong. It's just that Tableau doesn't automatically display. You just have to click refresh on the data source. So if you go to data at the top.
Okay.
And you find that essay sales there, you can click in and you have the refresh option.
Oh, okay. There is refresh. Oh, my God, you need a raise. Wow. So pretty much I rendered this issue that this field was not available in Data Self. I called the expert that knows Data Self. They will go through training to learn that kind of, you know, magic Greek or whatever that language is. And pretty much in a couple of minutes, I was able to. You were able to do it remotely? You didn't even connect to our network. And I had the control to refresh the data. And now the national account is here and I just drag and drop. Wow, that's amazing. Oh, look at that. National account now. This is awesome. But is there anything the roadmap in the future where I don't have to be refreshing because as a business person, maybe you shouldn't be giving me this power or I don't want to do it. Is there any way that in the future I don't want to refresh? I'm paying you to do this, so you do it all by yourself. Is that possible?
Yeah. In the future, our goal is to have an app or be able to do this online. We still won't have to log into your system or VPN or remote desktop. We'll have the ability to do this in an easier way. Like I could do this from an app from my phone or just logging in online to refresh without all the other hassle.
All right. The other thing that I think our audience will appreciate is this example we're going through shows when a data source is on premises. And a lot of systems today is moving to the cloud. So the idea here we're talking is if there's a cloud to cloud system, there's nothing to be installed on premises unless you want to maintain the ETL that currently is a Windows based application. And eventually, as Phyllis said, is going to be web based and even app based. But typically for probably quite a while, people will still have some data on premises, like Excel sheets, proprietary systems. So the idea of this ET' to have a mode where remotely you can connect your ETL anywhere that the ETL is installed. And remotely without going into remote desktop, you can log to the etl, you can be in a hotel, can be to the beach, log in and tell, okay, etl give me the data refresh and everything happens in the client's environment and this person doesn't need to connect to. So that's pretty impressive. Taylor, you've been with datacell for about a year, so you're still kind of new with our journey. What are your thoughts about data self and where we're heading?
I'm just so excited we're heading in this amazing direction and every day is just something new and something better. We're bringing in the data world. So I am beyond excited to see what is ahead for us.
All right, Taylor, thank you for helping I move along with my demo to complete it. Thank you. Appreciate it. You're welcome. All right. All right, so this is just a quick example of in real life how easy it is to bring additional information to an existing pre mapped system. Now let me finish this report very quickly. So this is the first report out of my dashboard. Sales by national, account, by customer, by year. I want to see sales by ship to. So I'm going to create a new sheet. I'm going to choose ship to state sales. I want to put this on a map. So now as a business person, these things are easy. I don't need to call Taylor, I can do it myself. Or maybe if I don't want to do it, I can call Taylor to do it. So just sales by state. And finally I want to put all of these two different queries, could be as many as I wanted into dashboard and make it interactive. Drag and drop, point and click. And I build this dashboard where I have sales here on the left with the details, the map. And if I save this report file and save as or save it with a different name. Now I could take this dashboard that I just created, including the new field I can open on a mobile device like an iPad for instance. And if I choose some states, it will filter the dashboard on the right. All the parameters of this dashboard will be filtered very quickly. This is the power of easy to customize the back end, easy to customize reports and dashboards. Now the last thing I want to show before I go back to the ETL plus to show you other things is what if you have a dashboard like the financial dashboard? Let's go back to that dashboard again. What if I want to Automatically distribute reports and dashboards on schedule. Suppose I want to get this dashboard and send to my CEO and CFO every day. I simply go to the dashboard that you want. You click subscribe and you tell who should receive. So Taylor would receive, Zach will receive. You just put the names of the people you tell how you're going to be distributing this report. It's going to be on a PDF format. You tell how often it should go out and you press subscribe and that's it. On this schedule, every day at 4am eastern time, this dashboard will be printed to PDF, refreshed print to PDF and emailed automatically to the people selected. Very easy to distribute reports. Now, keep in mind, this is extremely secured framework and we have security layers to control who have access to what in a very granular level. So people who should not see private information, they will not see private information. And we will teach you or give you documentation on how you can configure security. All right, now I want to show more about the etl, because after all, this is the ETL launch. So let me log to the etl. So I'm going to log with the ETL and it's already secured through a tunnel from my IP to the cloud. And here in the etl, the current etl, you need to be a SQL Server SQL statement familiar with. You don't need to be an expert in SQL Server statements, but you need to be familiar with that's the current version. And if you have those skill sets, this is very SQL statement vanilla framework. Whatever you write here, it goes to the cloud. If you need more tables from your data sources, you just pick and choose tables and they'll be added to the data warehouse. So very straightforward if you want to make and edit the query to do some calculations and whatnot, you know you can. It's just a vanilla SQL Server, I'm sorry, a vanilla SQL statement framework. Once you do your customizations, if you want to preview the data, you can click Preview to see if the data is coming through as you expected. If you want to delete, rename, upload now. I want to upload now. I press upload now and now the data goes to the cloud. Very straightforward if you are familiar with SQL statements. To change how often you want to refresh the data, you just use this wizard. So just click Refresh Schedule. This is the automatic refresh. If you want to refresh now, as long as you have access to it, you can click Refresh now. And then you have this counter where you can pick if you want to refresh everything, only the data warehouse, only the analytics layer, now Tableau, and eventually Power BI as well. You press refresh now and then the tool will just launch the refresh push to the cloud and you're done. So the current version of the ETL again requires SQL Server knowledge, basic SQL statements knowledge. But if you do, it's amazing how much you can do and how effective it becomes as an etl. We're going to have more webinars around the ETL process, but since we have a few more things to cover, I want to move to the next step. I cover customizations, back end and front end. Now I want to talk a little bit about legacy data migration. We're seeing a lot of clients coming to us because they want to easily. They're moving from one ERP to another or one CRM to another in the history. Transactional history is behind and they struggle seeing historical data from the legacy system with the data from the current system. How do we tackle that problem? So let me show the mechanics that we're building. This Excel sheet was actually a mock up we did from a real case scenario from one of our clients. They were moving from Sage business vision into Sage 300. That was the direction they're going. And they gave us an Excel sheet that had their Business Vision sales history, which is kind of pretty much showing here as dummy data, the invoices, document date, customer number and whatnot. Then we gave back to the customer this tab that added to the top the equivalent out of the box tables and fields that each field from Business Vision would map into Sage 300. So for every item we have the actual table name and field name. Once the client validated this, and that part took a little bit of time, the client with the reseller to validate this was correct. Then what we did was we got the confirmation from them. Then we converted this long table names, field names into something shorter for it people. Shorter is better. And then eventually this table here became the sales from Sage Business Vision. Legacy data we imported with DTL into the data warehouse and then we use the analytics tool in their case wasTableau. And there's a place where you go and you say union these two tables. So this is the legacy data coming from Excel we imported once this data is the live sales from Sage. You press ok, you press finish and that's it. When they're analyzing their data, their sales data is like they never changed from business vision to Sage 300. We have done this for Acumatica for Sage 100 for Sage X3 and other systems. Very straightforward. All right, product roadmap Right now, as Taylor mentioned, to refresh the system currently you have to be in the system where the data source is, unless it's a cloud system. The idea is by the end of this year you'll be able to refresh the data source no matter where the data source is in the cloud or privately no matter where you are with your local etl. You can tell the remote ETL please refresh your data now. So complete remote maintenance is coming up. Power BI in Excel is the reporting tools coming out soon we're going to be releasing the ETL plus Enterprise edition that has a full fledged data warehouse that you can have full control to it even going on premises. That's coming up shortly as well. We're going to have the web browser user interface. There's going to be wizard driven. So even if you do not know SQL statements, you will be able to add fields and tables using a wizard driven interface that will translate to SQL statements. If you want to use SQL statements you can, but you'll have also this layer in case you don't know SQL and super exciting. We are incorporating machine learning in artificial intelligence to help with the deployment, with the maintenance, with the fine tuning to keep the system humming without crashing, without any reliability issues. Because we want to have the machine learning to see issues before they happen and be sure the system is pretty dependable. We're also heading towards integration of the Azure BI stack. There's a lot of news coming out of that world and we're also being part of it. So that's the product roadmap in the long run. Pricing Advanced analytics starts at 299 per month. It takes about again 30 minutes to deploy. It includes actually 10 users, not five. And currently we are offering a 21 day free trial if you want to take advantage of it. How can you order it? Pretty much if you are ready to order, you can go back to our website again. You choose go to dataself.com click the system like in this case sage. I know sage 100. Scroll to this page to learn more about it and then see the pricing once you click Deploy Analytics. Now that's how you start the deployment process. All right, so that's by the way systems like Salesforce.com, sage Extreme, Netsuite, the starting price is 499. Other systems started 299 per month. It's a month to month contract and you can stop at any time. So little commitment to get your feet wet. But I tell you, if you get started feedback, you probably will love us and you'll stick around. So we just make it easy for you to give it a shot to see if data self will work for you. My last poll, what's your next step about data self? So let me open the last poll, would appreciate if you answer. A little bit more time because we're very interested in what your feedback is. All right, three more seconds. All right, thank you. So most people want to learn more, so people want to order it and some people want to keep on the radar. Appreciate it. Alrighty. That was my presentation One Way talk. Actually two Way talk with Taylor. I'm going to check now the panel to see if there are questions and yes, we have questions. So question here from Daniel. Can you schedule it more than once a day? Good question. Yes. So this initial version of hours, the EULA is to refresh automatically twice a day and you can also run automatically the on demand refresh as we roll out the functionality we're going to unlock for you to refresh more times. We have a client that wants to refresh every five minutes and we are making all of these things so you can refresh the system as often as possible. And in the future our goal is to even make things kind of real time refresh when it makes sense. So thanks for your question. Daniel, the questions here. Question from try or try. Maybe you show a SQL extractor is a part of etl, are there options that there you show and SQL extract is a part of the TLR options there. So I think it's try, I think. So your question is if there are options as far as the SQL extractor. So some of the good news is our ETL has been designed to work as one of your tool sets for data warehousing. If there are certain things you want to do in SQL, which is the data warehouse that the ETL is not ready yet or is not as easy as whatever tool that you're familiar with the idea is. Yes, once as we move forward and we open the full Flash data warehouse, you can use any tool to work with SQL Server to customize it. So we're not here to lock you around data self. We're here to give you options to more quickly customize the platform. Oh, so Troy is asking MySQL or API and etc. Yes, our goal is to open the ETL to have APIs on the ETL and have ways to integrate currently the ETL. This release the ETL is designed using C and Net but we're incorporating also Python library to work with etl. So the answer is yes, how we're going to be doing is still a moving target. But yes, we want to make it open so people can plug other components to make this ETL even more powerful. More questions here from Enrique. Hi Enrique from the other side of the planet. Any future plans to bring in SAP, erp, Oracle applications generic? Enrique, good question. Typically we have been focusing in mid market ERP and CRM systems. The SAP and Oracle, the enterprise versions, they are typically bi. Projects involving those systems are usually large projects depending how successful our ETL framework becomes. And if we have partners they want to tackle the kind of market, then we look forward to partners to be the last mile because tackling projects from you know, enterprise Fortune 2000 companies is usually huge in our focus at mid market, you know, we want to focus on clients that the projects are not three year project or you know, weeks and months projects long. So to be seen how we're going to be integrating with these enterprise applications, I'm going to take one more question because we're almost running out of time here. The question here, which one is the most relevant? Oh, question here from Patty. How does training works with Data self? Patty, good question about training. First of all, let me just get back to this page. If you go to dataself.com resources and training here we have material self kind of, you know, self. If you go to the bottom there's a bunch of videos on how to customize reports and whatnot. So feel free to watch the videos. The top we have training classes so you can attend training classes to learn more about Data self. We also have a knowledge base. You know, if you go over here and search on our website and let's say I want to see Data self ETL plus install, right? I want to see how the installation works. I mean Johnny, just show a few screenshots. I know that's not as simple. I want to learn more in the details. So you search for data 74 +install, you go to the knowledge base article, install data cellptl step by step you go over to our knowledge base and then you scroll through and you'll see the steps and with a good explanation of what each step is. But it's pretty much what I showed on the webinar is pretty much what you have to go through already. We're running out of time so let me just go to the next slide. If you have more questions, if you have you're going to discuss. You have here my email, my phone number, our website address. We are just at the beginning of this new journey. You know, we've been doing this for 15 years. We have built a lot of expertise across our legacy data warehouse framework. But the ETL+ is the ETL of the future. I mean, that's the present as of today. In the future, there's a lot of exciting things if you're a data geek to take advantage from an ETL standpoint. So stay tuned, follow us. There's a lot of great news we're making for you, the data geeks. If you are a decision maker, the dream is as you move forward, when you want to add something new to data self, maybe paychecks, maybe ADP, maybe Google Analytics, HubSpot, you have some Excel sheets, anything. What you want to do is to make a few minutes away for you to bring these additional data silos into data self. So you have the portal with everything in. About 80% of the questions you might have from the data source should be available out of the box right after a few minutes. And through training, you and your team can take the Next, you know, 20% of customizations and go crazy with it. That's our journey. If you want to join us to work for us, we're hiring a lot of people, so please contact me. If you want to help this vision, fulfill it as a reseller, as a partner, join us. If you're a client, want to be part of it, our family, please join us. Thank you for joining us. This video is being recorded. We're going to make it available for everyone. Stay safe, stay well and stay sane. In one month in the US we'll be out of this madness, at least part of it. And we'll continue making this, you know, our lives and move on. Thank you for joining us. Have a great day.










