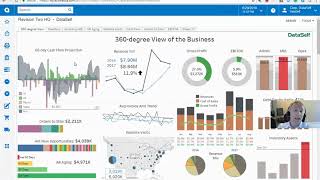
DataSelf's CEO dashboard for Acumatica shows a 360-degree view of key metrics: 60-day cash flow projections, orders to ship, AR aging. You can run what-if scenarios like excluding a disputed payment to test line-of-credit exposure, then drill into inventory by business unit and top products with built-in actions to call or email customers directly from your phone.
Chapters
Having said that, let's take a look at Data Self. So the way that I'm going to be showing Data self is by actually logging into Acumatica. Right now I have a testing Acumatica site and I'm going to be logging like I were the CEO of the company of this Acumatica site. So I'm going to log in as a CEO and one of the things is we can actually define for every person or group of people what their landing page will be. In this case, because I'm the CEO, when I log into Acumatica, let's say early in the morning, I want to see a 360 degree view of the business, meaning looking at data from all over my company. In this example, we have on the left side what we call the lead metrics metrics looking into future transactions. And on the right side we have lag metrics. Metrics are looking at past performance. On the lead metrics we have cash flow projection for the next 60 days, orders to ship, opportunities to be closed and ar aging. And the idea of these dashboards is to be very interactive. Let's say I'm looking at my cash flow in the next 60 days so I can see my inbound money from account receivables, I can see outbound money from payroll, from payables, and how much money I have in the bank today. So when I see all of this inbound and outbound money, I can actually see the projection of my cash flow in the next 60 days. And as long as the most negative number doesn't cross my line of credit, I don't have to worry about. So pretty easy to see and quickly say, no, I don't need to care about cash flow. Let's move on. Now. Cash is king. And sometimes cash flow can be an issue. Let's say as a CEO, I got to know that one of my clients is disputing payment, they're not going to pay. And let's say this is the payment is not going to coming in. Will that cause me any trouble? For cash flow I can click here and say exclude a payment and then what happens is, oh, I just crossed the line of credit. Now I have a cash flow issue. I might have to call the CFO and maybe try to work out a way. And I'm not going to be running out of cash or having issues with my vendors. So the idea of allowing people to do what if scenarios in dashboards to make quickly, more informed decisions is critical. And this is part of the advanced analytics capabilities that are available in a solution like Dataself, but not available or not easily available in something with built in functionality from Acumatica. Other things we do is, you know we have in this dashboard red flags. If a bar is red, it's because something is not good. So right here I see my inventory assets is too high. As the CEO I might be wondering who is responsible for this? Are they taking care of this problem? And then I need to take some action. Maybe calls the person, why not? So in this case what I'm going to do is I'm going to click on this bar and if I'm in Akumatica in something like similar, I would just see the underlying table populating this bar natively. That's easy to do, but if you need something else, it's not straightforward with data set up, I'm going to click on this bar and I go into a subsection of this whole dashboard showing me details about my inventory. So I see again the same chart here. Inventory by business unit, inventory of my top 10 products by cost on hand today. These are the top 10 products. And as I put the mouse over the bars it shows me in the middle section where those items are. And if the bar is red means it's above my threshold. What I can tell here is that a lot of my excess inventory is in the west warehouse. So aha, I have the aha moment and I might want to call the warehouse manager to ask what's going on? Are you taking care of it? Or maybe you want to email the person. So the question is do you have their phone number? Do you know their email address? Well in data self we can easily build into the functionality and it's something super easy to do. When you click on a label you have this pop up that asks you call the warehouse manager or perhaps email the warehouse manager. And from here you have an action. You don't have to look for phone numbers and email addresses right from a dashboard. It can give you the numbers and you can take action to take care of the problem. So here I'm showing one of our YouTubes where I'm showing that same dashboard on a smartphone. So same dashboard on a computer as on a smartphone. And let me show how placing a call to the warehouse manager in this example is so easy. So I just look at the dashboard, I can zoom in, click the West Warehouse label, click call manager confirm in the dashboard we'll place the call right off the bat. It's that easy to take action from these dashboards. So that's one example of advanced analytics helping decision makers to jump from an insight into taking action and taking care of business.