DataSelf adds interactive financial reporting to Acumatica. Drill down from P&L to subaccounts without leaving the report, switch between yearly and monthly views instantly, and filter dashboards by location or business unit to track KPIs like gross profit and wages.
Chapters
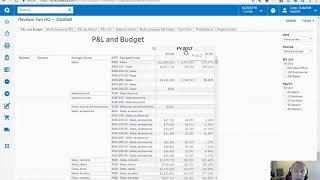
And let me talk a little bit of financials. So this is kind of similar product and losses and showing also budget from a year level, kind of similar to Acumatica. But here we have usually more ways to slice and dice the data. So I'm looking at the very summary framework. What if I want to see more details? I can expand to see the sub accounts so you can see more compact or you can see in more detail. What if I want to see the actual GL chart of accounts? Just like when I clicked a number here and I saw on a different tab the details. What is the equivalent available in data self? I can definitely do the same thing as in Acumatica. But from here I can also just expand and without leaving my P and L. Now for each of these P and L accounts I can see the GL accounts, sub accounts, branches, whatnot. So you don't have to leave the report to see more details unless you want to. And by the same token, I'm looking at a report at the yearly level. What if I want to see at the month level? In Ecumenica you'll have usually one or the other. If you want to see different things, you just have to jump from one report to another. Here you can let the user just expand the year. And now I'm looking the numbers on a fiscal period standpoint. So you do not need to leave unless you want to and keep your line of thinking, your analysis in the flow. We also have, you know, all sort of different financial analysis and also we do a lot of dashboarding out of financial KPIs. In this example, gross profit and wages. I can see the numbers throughout the months, I can see the ratios and it's all very interactive. What if I want to see this whole dashboard only for my head office? There it is. What about my commercial division? What about my retail division or branch? And as you see, as you change the filters very quickly, you change the whole dashboard. No matter where the data comes from, it can control the whole thing. That's part of the advanced analytics capabilities that are available.