DataSelf for Distribution
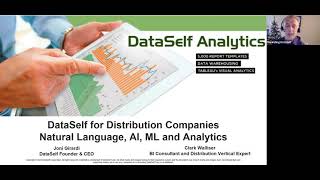
Johnny Girardi and Clark Walliser show how DataSelf helps distributors stop living in Excel hell. They demo dashboards for inventory planning and sales analytics, show a natural-language query tool that answers questions without coding, and walk through deployment and pricing.
Chapters
All right, I think that's it, right? Hello, everyone. My name is Johnny Girardi. I'm Data Sales founder and CEO. I also have with me Clark. Clark, would you please introduce yourself and turn the webcam on.
Greetings and good day. My name is Clark Walliser. I've been with Dataself about two years now. Come out of the ERP consulting industry, worked as an end user in distribution, manufacturing, et cetera, and then as an ERP consultant. And now I'm part of the business intelligence community.
We're trying to make Clark a data geek, but he's resisting. Never, never.
I'm concerned that it works for everybody out in the real world. It's wonderful though. It does work and that's why I'm here. That's just for the record.
There you go. Clark will come, bring a lot of his experience on the distribution world and talk about how analytics overall has been helping companies. Our webinar overall is talk about concepts. We're trying to give you as much education as possible. In the process, we also be talking how we do it. So hope you're going to find some education out of it. Even if you do not use Data Self, we'll talk about analytics for distribution companies. We're going to talk about how natural language, machine learning, artificial intelligence, and analytics overall adds value. The first good news for companies is organizations have a lot of valuable data in their systems. Probably if you're in this webinar, you're using one of these ERP systems, you know, Akumatica, Microsoft, Sage, netsuite. But most likely you or your clients have other systems. You know, Excel, very common data source for reporting, or maybe Google Sheets, CRM Systems, HubSpot, E Commerce. I mean, every company nowadays, if you look at how many digital systems they use to run their business, between payroll, social media, in one app, there's usually dozens of different systems run by companies. Data Self, we are a small business and we have more than 20 different systems. And when we're trying to understand what's happening with our client base, the many touch points of our clients, and partners with Data Self to have a full picture of what's going on, you know, you got to go through different systems. So data. This is what we call the data house divided. We're not talking about politics. It's about the data house divided. You have data all over the place, and if you're trying to look at your information consistently, it's challenging. We hear prospects coming to us and saying, no, they are flying blind. They have the data is right there in their systems. But when they have to, when they have that new question about the operations and they need a new report, good luck. It can take hours, days, even weeks to get the report. And sometimes when the report is ready, it's too late. The question was from two weeks ago, now is irrelevant. So flying blind is a common complaint that people have in using analytics solution. Data warehousing overall can tackle them. The other complaint we hear a lot of people not using data warehouse analytics is what is called the Excel Hell. Excel is a great tool. Nothing wrong with Excel, absolutely not. But the concept of Excel Hell is when people build their reports using whatever tool, Excel, Crystal Reporting Services or some kind of, you know, built in reporting tool in the ERP system and then different reports built by different people using whatever they thought it was the right rule. And when you look at the report, you don't know when the report was refreshed, you don't know why the numbers are not matching between the two reports. So not having a consolidated way to manage reports is very hard to keep what is called a single version of the truth. And one of the ways to call it this confusion is Excel Hell. Even though if you don't, even if you don't use Excel, very common complaint. And finally, many people say that reporting, you know, overall reporting maintenance is very labor intensive. Companies use hours and hours of people sometimes working every day, every week or every month to, you know, combine data, do calculations, validate the data is correct, email reports to different people. And when you do things manually, you know, it's error prone, so labor intensive and a lot of mistakes in the process. So that's another major complaint. A popular way to tackle these three problems, you know, flying blind, Excel, health and labor intensive is by using data warehousing technology in some kind of, you know, high end analytics platform. I'm going to be talking about the data self components here, but if you use data warehousing in high end analytics platforms, you're pretty much, if you do it right, you'll be tackling those three problems. So in our architecture is, you know, your source systems, your erp, your CRM, whatever it is, usually those systems, they do not take care of complex labor intensive reporting. You know, they're not very good for that. So the idea is you take the data out of them and you put in a separate database, a data warehouse. A data warehouse is a wonderful platform to tackle repetitive reporting tasks. You can tell the computer what to do on a recurring basis. So you don't have people to do it. Data warehousing used to be an expensive, complex technology. Nowadays, with the latest and greatest, with companies like Dataself, you can literally deploy data warehousing in less than an hour. So data warehousing today is easier, simpler and still very powerful for tackling those issues. Now, data warehousing is a data geek tool alone. It covers part of the problem. Typically you have to add a layer called the high end analytics layer tools like Tableau and Power BI. Right now they are the top two tools in the Fortune 2000 world considered for easier reporting and analytics. So we highly encourage you to look at those tools to tackle easy access to your data anytime and anywhere. So this technology usually will dramatically cut down your problems with the flying blind, Excel, health and labor intensive reporting. And if you get a solution from a vendor like Data Self where you have an out of the box solution, then typically the time to value is even greater. Data Self we have two versions, an entry level version with dozens of reports and dashboards, very powerful, very enlightening, very inexpensive. And the enterprise version of Data Self has more than 5,000 reports and dashboards ready to go on day one. So this kind of technology very helpful to address those issues. Now we're going to be showing this technology applied to distribution companies. We're going to show the concept of the data house United how out of the Box KPIs from BI vendors like DataSelf can help you focus on critical initiatives and how easy they become once you use high end technology. We'll show you also in our framework, the natural language component that has artificial intelligence machine learning to help better decision making process. We show customizations in how to do report distribution. Having said that, now I'm switching to the Data Self portal. Again. You can use your own technology to do to build things from scratch or some other vendors. But the idea is when a user logs to their BI portal, each user will have rights to access whatever they have rights to. So in this example I'm playing the role of, I don't know, the CEO, the CFO and I have access to several different data silos. You know, my sales, my CRM, my E Commerce, you know, marketing tools, more, you know, inventory management tools, payroll, everything in a single location. So you just go to whatever you want. The same credentials, you have access to all information that management needs to make better decisions. Without this, what would happen is management would have to go to log into their ERP to get some some of the data. They'll have to log into their CRM and then log into the payroll system and then log into their Google Analytics. Every system with the different reporting, with different credentials with the BI tool, with data warehousing, you have all of them in a datahouse united. As you can see here, the datahouse is no longer divided, is united. Now let me show some examples that with dataself we have built out of the box and we encourage you to either build from scratch or leverage something like dataself. I'm going to start with this dashboard called Account touch Points. What is account touch points from a distribution standpoint? Well, many distribution companies, they have a pipeline that the salespeople you know are managing the pipeline. Maybe you're doing this management in CRM system like Salesforce, Akumatica, CRM Sage RM or maybe doing Excel sheets or maybe you're just doing your ERPS quotes. But anyhow there's some kind of, you know, opportunity management. But then each client of yours or prospect, you have several other touch points with them. You have exchange of information with them, emails and calls. You might already have sales with the customer, you might have receivables open and some late. And if you're trying to understand all of these different touch points of your client with your business in a single page, that sometimes is very challenging. If you're not using a data warehousing solution, this out of the box dashboard is exactly that idea. So right here we have on the top left my accounts, I see open opportunities from CRM from the Excel sheet, whatever it is, just showing what's open opportunity by each one of my accounts thing that I'm trying to close. Then I can see how many interactions I had with each one of these clients in the last seven days, how many emails, how many phone calls. Of course you got to track those things somewhere so we can put it here. Typically in a CRM system then you can see what is an open sales orders, what's going to be shipping to these customers, how much sales you have for this customer in this case in this year, or maybe in this quarter, or maybe the last few weeks, whatever it is, you can see the open receivables for customer and if something is latent receivables. So a high level perspective of each customer with us with several touch points we can easily add here even more, you know, if you want to add something from what else we can add here, HubSpot, you know what email marketing emails these people have been clicking on? Absolutely. Once you bring the data to the data warehouse, you can plug to a dashboard like this. Now this dashboard Also has other widgets that give you insight into these different KPIs. So let's say suppose I'm looking at my customers and I see that this particular one that I have 36 grand in open opportunities, in opportunities they actually have quite a bit of late ar aging. How about that? Maybe you need to revise the situation and see, hey, if you don't pay your bill, we're not going to, you know, this opportunity is not going to go out of the door. So I'm going to click on this particular customer here or account and automatically my whole dashboard changes to show the details of this opportunity. Everything about the details I can put in this widget. I have the actual sales for this customer in the current period, in this case year to date. I have the open aging, including which one is late. I have the invoice number, I have the dates and I also see all the communication that have been done with this client recently in my simple system. I'm actually using acumatica feeding my system. But what I'm going to show you next would work the same way from any other sources that allow to go from a dashboard into their own system like you know, Salesforce and that suite. So I look at this email here and hey, what exactly did I email with this person? Or what if the account manager in this case is still talk with this customer? I can click on this link and automatically the tool will open a URL, a code URL that will open the source system and open that particular in this case email. It could be an invoice, could be a sales order, could be anything. The point is once you have a BI tool with data warehousing and using these high end analytics tools, you can take any data in your data silos in your datahouse divided, bring them together in your datahouse united and then plug into widgets of dashboards like this. So this is a kind of a high level perspective of the datahouse United States. And now I'll let Clark take over and proceed with his part of the presentation. And Clark, by the way, I need to give you mouse control. I'm not sure if I need to. There it is. Hold on a second. Give mouse control. All right, give it a shot.
I love being able to control those mice. Go eat the cheese. Okay, so we've been talking about different reporting options here and I'm going to step back one step. I come from the ERP world. Okay, there we go. I come from the ERP world and actually working in manufacturing and distribution companies. So I'M pretty applied, fairly applied on this. And you know earlier Johnny mentioned and I mentioned I'm not a data geek but I need those data geeks to provide what you just saw that is important information. So I just want to put that out there. One thing, another little angle on this that you might not think about. Over the years I've gone through where we start off on system A, then we upgrade or change to system B. Well system A had its own reporting system. Then we go to system B and we have to redo the reporting system and everything like that. With external data warehouses and systems like this you have the ability to just reconnect all of your data points from your old system to your new system and then all of your existing reporting continues on. That's a big advantage of using an external data warehouse and reporting system instead of only the ones in the erp. Just wanted to bring that in into play. Now we're looking first of all at the inventory planning dealing with distribution companies in my, you know, my kingdom for a horseshoe, my my business for lack of a product to sell. One of the first things we look at is inventory planning and this, this is a view quickly by product number, showing by week and giving you projections of what's on hand today. What's on a work order or purchase order supply coming in. What is on sales orders is projected demand. What are your calculated sales projections of how many you're going to sell each week and then you're on. So you're projected on hand and then compared to your minimum on hand requirements from your ERP system. So it calculates what you are going to be over or short based upon those projections. Now the ones I worry about are the red ones because red means short. So if you have an item and I'm looking only at my A items, so if I am short on A items that's a big caution flag to me. Be careful. You can looking at things comparing sales to year over to year to like trailing months. You can control how you do your on hand projection calculation. Some ERP systems will configure that they're on hand, projected on hand quantities different ways. So you can adapt to that. As I said, you can look at only your A items, B items, C items. Depending on how you configure those you can control which warehouse locations, warehouses or locations you want to look at. But again this is a quick way to see out of all of my products, what am I going to be short on. And so that's. Then you can go ahead and act, you can go, you can highlight just one item and get down to the detail data, behind the scenes, et cetera to get the full picture. Just wanted to point that out. So now if we look next, we're going to look at the sales part of it will go to the year over year sales. So first piece I want to look at, make sure I'm not running short on things that I'm going to need. I'm looking at my A items, et cetera. That, that's a critical thing. You don't want to lose all of your sales because of your missing a key component. Now, sales year over year gives the ability to track your trends quickly. This year's sales is dark blue. Last year's sales is light blue. So I can see my trends. You can see last year's sales patterns was very different from this sale year sales patterns. Well, why are the patterns different from one year to year, one year to the next? What has changed besides Covid and fires and extreme, you know, ice storms in Texas, et cetera. And you can take you get a quick look at your variance in sales dollars and the variance by a percentage so you can see what's going on. You also see between year over year where your sales have grown by the gray bubbles versus where sales have decreased by the red bubbles. So it shows you geographic trends, et cetera. You can track by each customer, see what their sales were last year versus this year and the variance between the two years. You have the ability to go ahead and sort that information. I can sort by the variance in descending order. So now I'm looking at my top customers that have grown over the last two years or if I sort it again, I can sort in eight ascending order by variance. And I can see these are the customers that I'm losing sales for between last year and this year. If I look at one customer, I click on that customer. The analytics tools oftentimes will have interaction between the different objects on the, on the dashboard. So I highlighted one customer. Now I can see the patterns and information about that one customer and which products that customer purchased. I'm drilling down on that. I want to see which customer which products were the lowest to the highest in sales. This is my biggest customer where I've lost sales from last year to this year. And I can see down to three products that were my biggest changed products where sales are much lower this year than last year. You can build patterns, you can imply patterns from that and kind of build a story and figure out what's going on and how to respond to that. So many little pieces you can go to there. Next, let's go ahead and look at hot and Cold. These are to me, very useful views. Who's on fire? Your customers that are the top customers this year. It's comparing by sales and. And you can choose period one and period two in the upper right hand corner. When you're comparing things that are heating up or cooling down, you want to say, I want first of all comparing one time range to another time range. So that's where you control your periods of time that you're comparing. And so this is showing your top 25 customers in that second period. That's good because now you can see these are the high sales customers. However, on the right hand side, these are not necessarily your top customers right now, but these are the customers where their sales have increased between period two and period one. So their sales have gotten much higher in the last section. And so they might become contenders for your next top customers. It gives you a snapshot of what's happening and who to look at. You can control. On the right, you could select only certain products or only certain customers to look at that information. You can go ahead and drill down and see. But I could make my first dimension that I'm comparing things by customers. So if I selected I wanted instead I want to look at my products, it changes the entire view to look at products. And I can now I can see my top 25 products by sales and my products heating up. So these are the. Using the features to make it as flexible as possible. In one view are characteristics of a good analytics tool. On the second side, what's hot is good, what's cold is actually more important to me because these are the people where the sales are declining from one year to the next. I don't. When I was working in the business, I wasn't always paying attention to who I did not talk to. I tended to, you know, focus on the people that were active in there. But then one client disappears and you know, well, all of a sudden, wait a minute, what happened to them? This is showing you very quickly, clients that have sold purchased much less in the second period than they did in the first period. Now if there were any clients in here that had not purchased anything in period two, then that would become, that would become a big flag that their sales have just completely stopped. In the current period you're looking for right now, there's nobody in there. But if I was to change these dates, then I might get records in there. You can go ahead and check it by product or by customer. I can see that my filter from my hot report pulled over to my cold report. So now I'm going to select my customer and there we go, my top customer, my customers sales are declining and now I have customers showing that there are no sales in my second period selected. This gives you the opportunity to identify who those customers are and to follow up and be a little proactive with them. One other report that I think is useful is called a daily Flash report. That's number 14 right there. Daily Flash. When I was working in the retail industry this is how we looked at things on a day by day basis. By default this view will show you for the current day or maybe the prior day depending on how your system is set up. And it's showing me just a snapshot of, you know, at this point in time what were my sales for the day, my cogs, gross profit dollars, gross margin percent and my total units sold. I might have key indicators that I want to always maintain a gross profit percent of 42 or 38 or whatever. And this gives you a quick look to see on a daily basis what I'm looking at, you know, what my numbers were. I can go ahead and check, select any day I want and it will reconfigure for that day. I can take a look at particular customers and when I drill down on, highlight that single customer, it shows me the information for that one customer so I can quickly see this customer, I'm making a 53% margin. The second customer down, I'm making a 30% margin, et cetera. So you have the ability to select individual customers. You can also select on individual products and see the results of that. I'm selecting an individual product and I can see my margin units sold and what customers I sold it to on that day. On the right I can see the individual transactions so I can get down to the detail. To me it's a useful tool to get a quick snapshot of how am I doing overall and it enables me to drill down to get more detail. I can see my locations, where it was sold, etc. That's about it for me right now. Johnny, I'll let you take over.
Thank you. Clark. An observation about the daily flash. Many of our clients when they were assessing data self and they talked about the flying plan problem, a very specific problem was management was saying that it would usually take days, sometimes weeks and even months to to learn that something important happened their business, you know, something really good or something really bad. The data was there, but they never saw the problem. And they've been saying this management, this more data driven management, that they need to be aware of important change in their business as things happen. They don't have to wait for a meeting. They don't have to wait for days, weeks or months to figure out something better or good happened. They want to see as it happens. The daily flash is a very important concept that you should be building in your systems for something like this to keep management abreast of things. And you can do a daily flash report for the salespeople for the VP of sales, another one for the CEO, another one for the coo. The point is, daily flash is important. What Clark has been showing is what we have available out of the box on day one. But the concepts are very important. Anyhow, moving along. So Clark showed some reports and dashboard that are usually valuable for distribution companies. If you're using technology like what we're showing here, you should also be able to provide natural language query to your users. Users, what is natural language query? Natural language query is like Google or Bing. You go to a place, you type in a question about what you're looking for and the solution will give you an answer. In bi. The answer is a report. And if you know how to articulate the question that the computer will understand, just like in Google, you got to learn the how the computer thinks. But if you articulate the question and the computer has the answer, you get an instant accurate answer to that question. And when you're using data warehousing and technology like this, any data in the data warehouse becomes a source of your natural language query framework. Let me show an example looking at my sales. So suppose I'm the VP of sales. I come to this natural language functionality say in data self and I say I want to see sales by salesperson in 2020. So just a question in English, by the way, you got to know English right now is the only requirement. But then the tool will give you hits. Like when you're searching the Internet, you have several hits and then you choose which one is right. You read the one that matches what you're looking for, you click on it and the tool will build instantly accurately a report with the answer. Like in this example by salesperson in 2020, he gave the sales in a descending order. This is not magic. This is natural language artificial intelligence. Machine learning working behind the scenes to help people who don't have time to learn more. Complicated reporting design to find answers to the questions anytime, anywhere. The Only requirement is knowing English and being able to type the question. Very empowering. And hey, what if I want to see by month? Sure you type by month. The tool will try to understand, give you options. You choose the right option in this case is this one. And then now by salesperson and give me a line chart and showing in 2020 sales by month. Maybe I don't like to see charts, I want to see a grid. I can go and say show me a text table instead. And now the tool gave me that information in a taxable format. Very empowering. It's not a magic wand. You will not answer complex questions, but a lot of, you know, simple straightforward questions like I've been showing you. It will give you an instant accurate answer and it's easy to get the information out. Hey, maybe I want to see my January sales by salesperson and get this data into, I don't know, Excel or some other tool. So I just selected those data points and I tell the tool get these data points into a different framework and allow me to export all the details into Excel. With a few clicks I exported all the data into Excel. And now if I want to do things in Excel, I have all the sales in Excel and I can do whatever I want in Excel. So natural language is also a popular way for people to find data that they want and then downloading something else to do whatever else they want to do in the other tool. So this natural language framework, many tools out there, Tableau and Power bi that both of them provide an amazing natural language framework. And when you combine those tools with a data warehouse, the datadig magic happens. It's amazing. Now what I'm going to show you next is the report editor. So when Clark was showing you kind of reports and dashboards available out of the box in Data Self, he was showing you pre configured reports and dashboards. But how can one design these dashboards? How easy or how complicated it is. In the next 10 minutes I'm going to show a very tangible example that will show you something like this. You bring a lot of data sources together, you just drag and drop and you build a dashboard that will have answers to your questions using the report editor. Now I'm going to switch to a different page where I have the report editor. Let me just reload this page. This report editor that I'm showing you is the tableau engine that is part of the data Cell framework. If you go with Data Self using our default approach, it's just part of it. You don't have to Buy anything else. It's all part of Data Self framework. Or if you're ordering tableau separately or Power Bi, you can also have this kind of functionality. Anyhow, in this example I am with a report editor connected to three of my data sources. I have opportunities for my CRM. I have sales from DRP in sales order from my ERP as well. I want to build a simple report just to show some of the mechanics of a new report from scratch. I want to see sales in open sales order by customer and then I want to see sales by geography and put this information together in a dashboard and make it interactive. That's what I'm going to show you in the next few minutes. So first of all, when I see sales by customers, so I in my sales data source connect to my sales in my ERP is my customer. I drag the report into rows, just drag and drop. And now you get all the salespeople from your from your database. I want to see sales, so I want to find the sales measure and I just drag and drop into my report and there it is, sales by customer. I also want to see open sales order by customer. Well, open sales order is in a different module in my erp but in Data Self is part of my data house United. It's right here. I select my sales order with all these parameters and I just find the open amount which is right here and I drag and drop and there it is by customer. I have open amount and I have sales order. Maybe I want to see open opportunities by customer and then I could go to the CRM opportunities drag and drop and there it is. It's that easy to make things like this. There's a lot of things that you can do that are more complicated. But a lot of the, you know, we say about 80% of the custom reporting needs of the average company. It's a drag and drop away in putting a few filters. So this one report, I want to create another report. It's going to show me sales by ship to state. So I'm going to choose ship to state my sales. So just to get a point and I want to see this on a map, very popular among salespeople to see by territory what's happening. And in this example, the bigger the bubble, the bigger the sales by territory. And then now I want to put these two different widgets into a dashboard that is interactive. So now I'm going to click and say I want to see a dashboard and I want to see my tabular report on the left in my Map on the right and let me get rid of these bubbles. So there it is. And actually let me make this to auto fit the screen. So whatever is the size of your screen is going to automatically adjust itself. And that's my new dashboard. Buy customer, see open, open sales, order in sales. I'm going to save this report which I recall Sales Dashboard 1. I save it and now I have a new report from scratch. If I close it, I close and I tell my sales team, hey guys, go and search for my dashboard one, which was the name that I called this dashboard. I think it's a space one. There it is. And I'm going to click this dashboard I just created. So now I'm no longer in the edit mode. I am in the view and actually I open another one. Sorry, looks like I have more than one. So let me try again. Dashboard number one. And I think this should be it. And I think this is the one I just created. Ah, technology. There you go. So the report that I just created as a viewer, I don't know how to edit, I don't know how to change, but I know how to use it. I can open this dashboard in my mobile device, in my tablet, in my smartphone. And suppose I am responsible for the east coast of the country. I could use my finger on my mobile device and select the states that I'm responsible for. When I select it, what happens is it filters to shows me the customers that I'm dealing with. So highly interactive dashboard that it took me a couple of minutes to build from scratch combining different data sources. And that's the power when you're using data warehousing technology as well as high end analytics tools. If you're not using data warehousing and analytics tools, I bet you you're not taking advantage of this kind of power and decision makers today. They need easy access to information to make more informed decisions. To fight the internal corporate fake news. To fight the. Yes, the internal corporate fake news. So highly encourage you to pursue this. Finally, you know, okay, I built a dashboard. It was very interactive. I can look in mobile device whatnot. But what if I don't want to go to the dashboard? I want the dashboard to come to me when I want it. In other words, I want to distribute this report or this dashboard automatically on a schedule or when something happens, how can I do it? Do I need to call someone to tell what they want, how they want to wait? Yes, that's one option. But you can enable your users to have the subscribe button on the user interface so as a user I can click subscribe and then I'm going to tell who's going to receive this dashboard Clark for sure. I'm going to add Zach and all my people. I want to myself as well. Do we want to receive Everything can be a workbook. You know, maybe you want to send your financials, your financial booklet at the end of the month or the quarter for all people. Then you have a workbook with several, maybe dozens of tabs showing different things in a single workbook and you tell send the whole workbook for these people as a PDF. Call whatever you want your email and send it, you know, let's say every week at Monday 5am and click subscribe and that's it. Distribute reports can be completely self service or you can have admin people to configure who's going to receive when. Again, high end BI technology to make repetitive reporting tasks something that computers will do so your team can focus on what only humans can do, which is using their brain for improving life in the community. Alrighty, so let me go back to my PowerPoint. So I kind of showed the datahouse united the KPIs. We have a little out of the box for distribution companies. Natural language customization, report distribution. Now if you were to go with Data Self, you know again you can use other vendors built yourself but if you go with Data Self how easy would be to get the out of the box we showed you today. There's a lot more but we show you the basics. How much effort in money would take you to get Data Self out of the box up and running. Well it takes minutes to deploy what we showed you today. Out of many popular systems like Akumatica, Sage, Netsuite, Microsoft and whatnot. You can order your data self directly from our website or you can also contact your var. You'll get a process to deploy Data Self. If you have on premises system, it takes a five step process to deploy theirself. If you have a cloud to cloud system you don't have to deploy anything. We'll just be exchanging some credentials and you know, once the system has been refreshed, usually can take you know, a few hours off you go. Your data self advanced analytics is up and running. So deploying Data Self out of the box is a fairly straight process. Again usually it's minutes away. Part of our magic, you know the Data Self magic is using Data Self etl. ETL stands for extraction, transformation and loading. It's a tool that is designed to make data warehousing simple, powerful and inexpensive. As I mentioned, Data warehouse used to be expensive, complex, a nightmare. It's no longer that way. If you use modern ETL tools like ours, it's easier, it's fast, it's inexpensive. You still need to have a data geek in house to do maintenance of the data warehouse. So it's not easy, it's easier. But as I mentioned, in half an hour you can deploy your Data Self Data Warehouse leverage our ETL plus and it's an amazing tool that we're going to make even better as we move forward. So if you want to learn more about our etl, please contact us. How much does Data Self cost? Well, the entry level of Data Self which is called Advanced analytics, it starts at 299 per month and there's a 14 day free trial. We also have the Enterprise analytics which is a more comprehensive solution. The Advanced analytics comes with dozens of reports and dashboards and everything you saw today is part of this fee. It includes 10 users. If you go to enterprise that we did not show today, you get thousands of reports and dashboards that are out of the box in a lot more functionality. In case those make sense. Typically if you're a larger business, large data volume, multi company, sometimes those are the things that sometimes drive the technology to use the enterprise and not the advanced analytics already. Having said that, we're going to open the questions and answer session so please use the Zoom panel to ask questions before we check questions, just to review what we covered here today. We highly encourage you to use data warehousing in high end analytics tools like Tableau and Power BI to have your data house united and hopefully what you saw today in our demo will give you a hint into the power you can give to your management for better decision and the power you're going to be giving to your it, your business analysts, the people who today are doing your reporting, they're going to become a lot more effective using their brain for what people can do and let the mechanical part of reporting dashboards to be automated by a high end data warehousing in analytics platform. You should strive to make easy access to KPIs to your management. Again, Power BI and Tableau are an amazing tool to do that. Excel also very popular. Many of our clients use Excel as the way to get the data out. When you plug Excel to a data warehouse, you pretty much get out of the Excel hell and you become into the Excel heaven. So using Data Warehouse as the back end and Excel as a front end, you can have Excel Heaven even Though again, Tableau and Power bi, they are much easier and more empowering when it comes to known tech is to see their own reports and dashboards. With this kind of technology. Pretty much anything that is mechanical and repetitive that usually humans do, most likely most of them, sometimes all of them would be completely automated by the data warehouse and the analytics tool. So dramatically reduce labor intensive reporting using this kind of technology. If you're looking for bi, look for tools that already have a mature natural language, artificial intelligence and machine learning engines. Tableau and Power bi, which are the two leaders, each one of them, they have this engine that is about five year old or older. So it's still young as a technology. But in five years they came a very, very long way. I see many companies looking at their BI investment without looking at this into me s, I'm not sure you're looking at the right angle. If you have a bi, you make a lot of investment and you don't have natural language really. I would say just think straight. Maybe give us a call to talk about it to see if it makes sense. Maybe we're just crazy data geeks or maybe not. So feel free to call us to see. Hey, but it's more affordable the other two. We don't care about natural language. Let's talk about it. I think if you hear our stories of how this can be empowering, you might realize the extra cost is actually really worth it. With ours again deploys in minutes. Our competitors, as far as I know most of them take hours, sometimes days and even weeks. So we try to make it easy and affordable in our starting price is very affordable. Alrighty. Having said that, let's see if we have questions. The QA section here. Looks like they changed again. The interface zoom is changing every week almost in the session that I usually look, there's no question. So let's move on. You're going to get a few minutes for free for your day. I really appreciate that you came and joined us. We are data geeks even though Clark is not there yet, but we're trying to pull him in. But we're here to help. We're here to listen to you guys. We're here to hear your challenges with BI reporting and then share some of our knowledge over the years. If Data Self is a good fit for you, you love working with us. We are a bunch of fun data geeks. We love what we do. We care about our clients. We do our best. We're not perfect, but I don't see any other company in the mid market bi company in the mid market that is effective in a splunk to work with the data self. Clark, any thoughts from you?
I might not be a data geek but I am concerned about data and that's one of the things I appreciate about this. If those of you out there listening in, you've probably tried to roll your own data reporting over the years try to come up with your own solutions I did that for 20 plus years coming up for my own solutions and data self and I, Johnny and I have talked for over a decade and the value of having something pre designed that you have a whole team of people managing can you can get productivity out of it almost immediately that is was worth a lot to me and that's part of what draw me drew me to data self and I'm glad to be here even if I'm not quite a data geek.
We're trying, we're trying to slowly convert Clark, you know when he joined us he would never say cool for anything. Nowadays they know quite often they say oh it's cool. So we're like yay.
Some of the things are cool. Yeah.
All right folks, thanks for joining us and have a wonderful day. Stay safe and well. Thank you.
Bye bye.










