DataSelf for Manufacturing with Natural Language
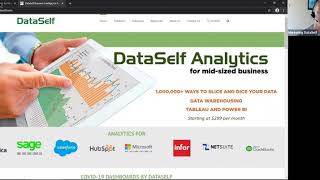
Webinar (Oct 2020) by Johnny Girardi, founder & CEO of DataSelf, demonstrating DataSelf’s analytics platform for manufacturing. Covers reporting challenges in manufacturing (ERP/MRP data silos, complex BOMs, inventory planning), DataSelf architecture (data warehouse + Tableau/Power BI), natural-language query demo, out-of-the-box manufacturing/sales/inventory dashboards, report creation and scheduling, pricing tiers, and deployment timelines.
Chapters
Hello everyone. Thanks for joining us. The webinar will start shortly. Just going to make the final preparations. Let me put my webcam on. Hope you can see me. And let's see here. All right. All right. Good morning or good afternoon everyone. Happy Friday. I hope you're staying safe, well and sane. It's been hard to be to get to stay sane lately. I hope you're keeping up. I'm super excited to talk about data cell for manufacturing. We recently started to put vertical in our marketing in this, our first webinar in years for manufacturing. And the idea is every month we're going to be keep on improving it and providing more content. So if you have comments or questions, please let us know. If you don't know me, my name is Johnny Girardi. I'm data Sales founder and CEO. And today we're going to be showing how data sample manufacturing, leveraging natural language, artificial intelligence and analytics makes the life of decision makers in manufacturing companies easier. Let me talk briefly about the reporting challenges that people come to us when you know, they are manufacturers. A very high level one is many decision makers complaining that they're flying blind. It's very hard to get data out of their systems, their erp, mrp, other systems and they need better visibility on the IT side or you know, the business analysts that support decision makers. Usually the complaint is their current reports and BI infrastructure is complex and time consuming. There's a lot of hours on an ongoing basis to keep up with the demand from decision makers. So very high level complaints we hear over and over and over from these two different group of people on the manufacturing. More specifically, you know, manufacturing is usually a very complex operation. If you don't have some 10 cent fuses to build the work order, guess what, maybe you cannot start it at all. You know, sometimes a single unit missing from the bill of materials prevents the whole thing from happening. And it's very complex. You know, how many items should you order? How do you look at the quantity on hand, the items that are coming out of production? There's so many variables in manufacturing in so many companies that try to set up their MRP system, you know, to help with managing their operations and is usually complex, it's usually time consuming. I was talking to an expert in the manufacturing business and she said that one of the reasons why so many MRP systems are inefficient. And she said 20% of the MRP deployments are very efficient, the other 80% are not very efficient. And she said the reason is because if you have a manufacturing process that is highly scalable and repetitive, then a manufacturing system can do it well. You know, an MRP system can do it well. The problem in the mid market, which is my world, most manufacturings, they don't have a highly repetitive process. And that creates a lot of challenges in the manufacturing process as well as in the reporting side of the manufacturing process. So that's why many companies come to us. They need a lot of reporting, a lot of changes around reporting around manufacturing. And we make it much easier for them to take care of that. Many manufacturing companies are also highly sales driven and sometimes analyzing their sales operations, their sales orders is critical. And many companies go with data self also because we help dramatically improve the focus on strengths and opportunities out of your sales operations. Inventory planning usually is part of manufacturing, sometimes not really, you know, manufacturing more the bill of material kind of things. Sometimes inventory planning goes beyond that because sometimes many manufacturers, they buy a lot of products and they just resell them. So being able to do a better inventory planning is also data point that we usually help manufacturing companies and of course financials, you know, P and L, balance sheet, things of that nature. So these are the reporting challenges that we hear often and we can help how our technology works. So first of all at the bottom here you see the ERP systems that we already connected out of the box in what. And these would be the kind of the data sources. As starting point, we can bring any data source together. You know, ERP system, CRM, Excel, Google Analytics, payroll, E Commerce. No matter what data you have, what we do is we use data warehousing technology to bring the data silos together. So one benefit of data warehousing is just to have all the data in a single place, to have a single version of the truth. The second benefit is a lot of the reporting needs require a lot of data preparation and manipulation and blending and calculation. Instead of doing in Excel outside, we can do everything the data warehouse automatically. So anytime you need to get the data out for reporting is being refreshed, is being recalculated in the KPIs already to be reported. So easier to do data preparation. Finally, when you're running reports against a data warehouse, you're not hitting live the system and you're not slowing it down. That means you don't slow down the source system and reports running seconds. Because data warehousing delivers data for reports really quickly. Then we would use analytics tools like Tableau, Power, BI and Excel, which is like the lipstick, is a flashy, beautiful tool that People can access their data anytime, anywhere, using computers, Macs, mobile devices, web browsers, quick and easily, anytime, anywhere. We've been doing enterprise analytics for 15 years, since 2005. And in these years we have built a library of reports and dashboards that cover a lot of different business needs. You know, from financials to receivables, payables, manufacturing, CRM. And today to get the complete solution, we have more than 8,000 reports and dashboards ready to go as soon as we deploy the solution. So there's a lot of value. So that's how we actually help from a reporting standpoint, manufacturing companies and others. At the end of the day, when it comes to benefits, you know, decision makers will no longer fly blind. They'll have easy access to their key performance indicators instantly, accurately, anytime, anywhere. And the people who support decision makers, they will usually find the setup is simple to set up data itself. The maintenance is fairly, you know, self serving. It just kind of just runs. Usually you don't have to do anything and you need to do something. It's usually easier than the process they're going through today. And a lot of the reporting tasks, you know, those repetitive reporting tasks that people do, you know, calculating in Excel macros, exporting things, manually crunching, manually distribute reports securely, all of those tasks or most of them become completely automated by data self. So those are the main high level benefits of data self. Let's jump right into the product and take a look how data self helps. So I'm going to be showing a few different pieces of data cell for manufacturing. The first part I'm going to be focusing on natural language query. And then I'm going to show manufacturing. Then I'm going to show sales in inventory planning. But natural language query is like searching the Internet. But instead of Internet being the source, the source of your data is your ERP system, your MRP system. Whatever is in data self becomes the source of your data. And when you ask a question in the computer, give you hits and you choose a hit, the answer will be a report built from scratch. So right now I am connected to my ERP system looking at sales. And in our system we can look at sales, you can look at manufacturing, bill of materials, work orders, financials, anything. The point is, as a business person, I don't need to learn report creation. I just have to ask the computer. Sales by salesperson. In 2019, I asked a question. The tool will use natural language to understand the question and give me hits. I check which one is the right hit. I selected and Then data cell will build instantly accurately a report to that question. So in this example I'm seeing by Salesperson, sales in 2018 sales in a descending order. So ask the right question or articulate the question correctly. If the computer understands what you're asking and you choose the right option, it will give you the report. Show another example. If I want to break this down by month, so now I want to see sales by salesperson in 2019 broken down by month, same thing, it gives me hits, I choose the right one, the tool will build a new instant report. This example, 2019 by month by salesperson I see sales. Some people say this is magic. Absolutely not. It looks like magic, but is using natural language and properly connected tools out of your source system to give decision makers easy access to their data. Now I'm looking at a chart with line chart. What if I want to see a different representation? Maybe I want to see a text table like Excel. Sure. So now I'm seeing the same report looking at numbers by the penny. Many decision makers find this very informative because they can find answers to many of their questions without calling anyone else. They just have to search, get the report and sometimes they want to get the data out, let's say into Excel. Sure. You can select data points. Let's say I'm going to select the whole month of January and then I want to say, hey, give me this information to get it out to export, I'm going to say view data. And right now I have those data points here and I could export only those data points. Or if I want to see all the underlying data. In this case I'm looking at invoices or sales. So if I want to see invoice number, invoice, date, quantity shipped, gross profit, any detail behind those data points become part of this export and I click the download and the tool will export into Excel all those data points. So natural language, super empowering for those users who do not have time to learn complicated reporting tools to become more self sufficient. Now, just like searching the Internet, you know, many questions will be answered instantly and accurately, but a lot of questions will not. And you have to still call the business analysts, the people who go through training that know how to use the tool to either find the right reports or dashboards or to create new ones from scratch. So I'll show later how to do that as well. So natural language, super empowering as a way to get some answers. What I'm going to show you now is the manufacturing out of the box or some of the dashboards we have built for manufacturing companies, the first one is actually a pretty high level dashboard. And this is usually highly customized to show bigger metrics for usually C level people. You know, they want to see the big metrics, to see how they're doing this example by products, they want to see units produced, percentage loss and then you have the bars for the produced, the circles for the, for the percentage loss. So to see, kind of keep track of what's going on, then maybe I want to see average hours to produce and then by product, by operator, I can have an idea and see why some people are more efficient than others. I want to have visibility into what I have to ship in the next days or weeks. Defects are usually big for many manufacturing. So I want to keep track of what are the issues of my defects where I'm producing my products. And here is also another way to look at defects. So this dashboard is just an example of a very high level way to look at the manufacturing operation. And these dashboards are highly interactive. Let's say what if I want to see what's going on with these top three products by units produced, you know, what's happening with them. When I select these three products, automatically the whole dashboard will change to only show the hours, you know, worked by person shipped in next few days and the facts around those three products. So very interactive to see KPIs across different units of the manufacturing component. Now let me go also and talk about bill of materials. Bill of materials is usually a big piece of the manufacturing process. And we have many clients that actually do not have an MRP system. They use the, you know, they use the actual ERP system and they usually use Excel sheets and crystal reporting services to do the their bill of materials planning. And then it becomes a very complicated job, usually very slow system crash, frustrating. Especially when you have multi level bill of materials. Bill of materials. It's kind of thing that is very hard to report. Just give an idea here on the top left. Let's say I have my finished goods, which items I need to produce, and you have how many you have available, how many you need to produce, and if you're short or not. This is a very simple perspective of the finished goods that I need to fulfill a certain order, for instance. But these three columns per se can become a complicated topic for each individual company. For instance, what exactly is the quantity available? Is it the things you have in stock that you can ship right away? Are you purchasing some of them so you can make part of a bundle and Ship them? Do you have some of them being produced? There's going to be part of your quantity on hand and how many days can you wait to become available? Just defining the quantity available sometimes is a lot of discussions in a lot of metrics or a lot of calculations to properly populate the quantity available on hand to fulfill your orders. So in manufacturing it is amazing. Every metric, every number, usually there's a lot of rules behind the scenes to actually calculate it properly. Now in this section here I have the finished goods exploded, meaning I take my finished goods and then I see which items or sub assembly is part of my level one bit of materials. Which ones require a sub component, level 2, level 3, level 4, level 5 and you name it. You can go as far as you want to want to go in data self out of the box. Our bill of materials comes with five levels. So if you have a single level bill of materials up to five out of the box, we already have many of the structures ready to go to plug to your bill of materials. If you have more 10, 20, we absolutely can extend the framework to go as deep as your bill of material needs. Then you can see, you know by each component what is required per bill of materials, what's available, which has the same perspective as this one. And then you can see what is the required for each of the levels and what you're short. At the bottom we have the raw materials. You know, this is kind of a structure. You can see for every level what you need. At the bottom you have all raw materials per bill of materials. I'm sorry, all raw materials for every finished good that you want to produce as well as all the raw materials you need to fulfill this particular, you know, batch of work orders. So this is just like a report when you, when you open you see the numbers. But typically people have problems. You know, some items are not going to come, they're going to be late. I need to focus on some of the things and this is the beauty of once you have this in place, suppose you look at some of these items. Hey, this item here is going to be late. Which of my finished goods this item is going to be delaying. If I click on this raw material, it will automatically filter the other sections hotel where this raw material is being used. In my case, I only have one. Let's take some other item that hopefully have affects more. There you go. So I select these three raw materials and I see where they're going to be affecting my production and then I can call the client to manage delivery. Or try to find a different vendor so I can still deliver things on time. But overall, the point is these dashboards are highly interactive. If you choose actually need to deliver this first. When I click in one of those finished goods, it shows me all the details that I have to take from a bill of material standpoint to finish my work orders. All right, so this is a little overview of the manufacturing components of data self for manufacturing. Let me talk a little bit about sales. A lot of manufacturing, they spend a lot of energy being sure they have a well oiled machine on the sales side. And we have lots of reports and dashboards to help sales, you know, VP of sales and salespeople to look at their transactions and try to find opportunities and threats. This is a popular sales dashboard that shows year over year trends. A lot of manufacturing, they have some kind of seasonality and they want to see how they were doing last year compared to this year. So this is a quick and easy way to do that. Right now you pick the year on this dropdown, you select the periods, you see the total for this year, last year, the variance. And if you only want to see year to date or for certain periods, you just select the periods you want to see. You press apply. And now the dashboard will affect in this case on a year basis through the period nine. You see the trends over time by period, you see by location, ship to or bill to. You see your customers, you see your products last year. These are invariants. And everything is again highly interactive. Right now I'm looking at my customers by sorted by sales in a descending order this year. What if I want to see what my top customers last year are doing this year? I can quickly sort by the prior year instead. So now this report is showing my customers sorting a descending order by last year. And I can see two of them have major decline. Huh, what's going on? Well, I can select those two customers with major decline. And now the whole dashboard changes to affect the totals for those two customers together. Trend analysis, ship to analysis and what products are down the decline. Very interactive. Or maybe I want to see what we call the hot organic cold performers. The hot ones are we call on fire. What are on fire customers in this example or the customers with the biggest sales in a given period? Or the heating up customers hitting up customers are the biggest ones by sales growth since a prior period. You define the periods here and then you can see these customers which we call the hot customers. What if you care about the product instead? Instead of customers, you just change this dimension from customer to product or any other entry. And now the report will be showing the hot products, the on fire ones and heating up ones, very easy to see hot and getting cold performers. In some organizations looking at the Pareto analysis can be also very informative. The Pareto analysis is a way to look at, let's see my profitability by let me say by customer here. So right now I'm looking by customer, sorting a descending order by profitability. And then I can see sales and the ones in blue, they represent 80% of my total profitability. And the question is why some customers, even though they have large sales, why they're not as profitable and sometimes they are even unprofitable and sometimes it's amazing. Some organizations when they look at their Pareto, they realize they have some major issues with some customers or products and they were not aware of them at all. So very simple perspective into sales trends available out of the box with data self. Another report that is very popular for some businesses is more refined way to look like the parent analysis is called the Whale curve. What is the story behind the Weill curve? Well, if you take a business, I mean factory business, and you divide that business by all of your sales, I'm sorry, your invoices, you have an overhead per invoice. Every time you have an invoice, you have an overhead which is the total overhead divided by the number of invoices. Now if you look at your customers, some customers ask to ship a lot of invoices, some others just a few invoices. So those customers who ask for a lot of invoices, the overhead to serve them can be much higher than the ones that don't ask a lot. And this is the perspective the well curve puts on the bottom all the customers. And these bars are the sales by customer. The bubbles are number of invoices per customer. These bars here is the gross profit per customer. And then these other arrows up and down is actually the gross profit minus the overhead per customer. Well, the overhead is the number of documents multiplied by the document overhead, which is a parameter. And by doing that you can see that sometimes some customers that were profitable, otherwise when you look at how many invoices you're shipping, they become a net negative profitability. And that's where the well curve comes in. You know all these things that are black going up, these customers are adding to your net gross profit, all the others are actually decreasing from your total gross profit. And sometimes this perspective for some businesses is amazingly inspiring to tell how they can try to reduce the number of documents or how to restructure the business in a way that those clients with higher volume transactions are still profitable. Again, highly interactive. Let's say what about these customers here? Who are they and why are they so profitability so negative? From a well perspective I can just keep them only right now I have a zoom into them. I can see their names on the bottom and do more further analysis. Just a very quick overview. We also have loyalty dashboards that you can see your loyal customers with different perspectives, how you're managing managing them and be sure they're not you're not having friction with your customers. The last out of the box they want to show is the inventory planning part of Data Self which which for many companies, for many manufacturing companies is part of the MRP process. For some others is outside of the MRP process. But the idea is you have your products and then you have how many you have on hand today, how many you have on work order. And this line could also add any inbound items you know. If you also have open purchase order, this line would have anything inbound, open order, open sales or open purchase order as well as on work order. This line is what is expected to be shipped that is available already in my open sales orders. This line is sales projection. For many businesses the sales orders are only part of the sales projection. So this line we can calculate your actual sales projection based on a different series of variables. Once we combine that information, we can see what is the on hand projection. This would be this current day or week or month. And then this would be future in my several databases, week, future weeks. So the on hand projection at the end of this week, next week and so forth, this would be the minimum quantity on hand by product that usually is available on the ERP or mrp. And then based on these two parameters I can define if I have excess or short of my inventory. Like in this example when my X is short went negative, it shows that I'm going to be running out of inventory on week 40 for this particular product. This is some people ask is this competitive netstock kind of solution? Kind of yes and no. It's a simpler framework. Netstock and tools like that have much more elaborate ways to project sales and whatnot. But Data Self provides the basic framework. It can combine a lot of data, is highly customized and for companies with simple production needs sometimes is an easier, faster and even more affordable way to do inventory planning. So this is primarily an overview of the out of the box reports and dashboards. My last example Before I go back to the PowerPoint is to show how users can actually create new reports from scratch. Everything that I showed so far is what we call the viewer experience. Is a user that can interact extensively with the reports and dashboards that are created either out of the box or by your team, but they cannot change the structure of the report. They cannot create new reports. Aside from the natural language query, what I'm going to show now is report creation how a user who goes more, who goes through more training, they can build new reports from scratch. I'm going to take my essay sales data source and these are some of the examples of the data sources we have available out of the box. I'm going to build a new sales report and I'm going to start a new workbook that would be like a blank sheet of a sales report. Here we're leveraging this example, the tableau engine which is part of the data self whole framework. And I'm going to build a simple sales dashboard showing sales in a given period by customer and by product. And I also want to see sales by territory when I build this in a dashboard and make it available to my sales team. So right now I am connected to sales that is pulling data from my ERP system. I want to see customer, so I'm going to put my customer name in my rows and I want to find sales and put in my report. So very quickly, sales by customer in the whole company history. Who's my top customer in the company history? I can just sort in a descending order. These are my top customer by sales, the whole company history. Well, I want to see sales in a given period. Well, I can find the document date, document date and put in my columns by default the tool will break down things by year. Well, I want to make a filter to only see a given year. So I'm going to tell show this as a filter. And I only want to see my latest year in my sample database. And now I want to drill down to see things by month. So I want to drill down from the year level to go to the quarter level to go to the month level. So right now I have sales in 2019 by month and actually let's make a filter of my month as well. So and let's just say I want to see only let's choose a couple of months. So there it is, sales by customer by month in those periods, point and click there you get the report. Well, what if I also want to break down by product? I just have to find the parameter on this list in products right here. And I can drag and drop. And then the report is created right in front of my eyes by customer, by product sales in January, February, if you actually want to see by product by customer, you just reverse all of these pills. And now the report is by product, by customer. Super simple. All right, so this is kind of, in a way, tabular report creation. The basics, if you know how to drag and drop, you can do it. I'm going to create a new sheet and make a report showing sales by territory. So I'm going to choose state, ship to state and sales. So just pick those two fields and I tell my tool, show me this on a map. And right there I see by every state in the country, sales where the size of the bubble is proportional to the sales. That's it. I created those two different sheets and now I'm going to make them part of what is called a dashboard. And a dashboard is a way to put several sheets together. They can come from different data sources. They can come from the same data source. This example, they're both sales. The sheet one is a tabular one. The sheet two is the map. When I put on the right and in a few minutes, I built from scratch this dashboard that has my sales by territory and then my details on the left. I want to create and call as my, you know, let's say new dashboard one. I save it under my sales, which is like, you know, where my salespeople are. I click save it and that's it. I just created a new dashboard from scratch. I'm going to go out of the edit mode to go back to a viewer mode. And I'm going to find the report that I just created, which is under my sales folder. And that's my first dashboard. I'm going to click the dashboard as a viewer. Now I'm no longer in the report editor as a viewer. I have access to that report, which actually, I think I clicked the wrong one. This is the right one. Sorry. There you go. That's the right one. So I see my sales by customer product for two months and then the territory here. And now that I'm looking at this dashboard on a mobile device, for instance, if I were to use, say, my fingers to select only the west coast, look what happens with my dashboard. It's highly interactive and I can start to slice and dice it. Let's say that I created this report for the west coast and now I want this report to be automatically emailed on schedule for my salespeople in the West Coast. What I do is I just click subscribe and I want to add myself plus other people. I just put the name of the people which my sample database. I don't have other people right now. Well, I have Clark here. So let me add Clark and then I tell you know, email this is a PDF and send this let's say weekly on Monday, let's say Weekly Monday at 5am Pacific. Subscribe and that's it. In a few minutes I create the report from scratch and then I schedule for auto distribution completely. Hands off. This report will go out to everyone that I selected on that particular time frame. So as I mentioned the beginning with Data Self leveraging the data warehousing capabilities in the beautiful lipstick which I'm showing right now is tableau, you can dramatically simplify the manual tasks associated with reporting so we can focus on decision making and not as much as data preparation and manipulation. All right, let's go back to my PowerPoint. The price of Data self starts at 299 per month and that's for the Advanced analytics component. You know Data Self has too many additions. The Advanced analytics which takes about 30 minutes to deploy or less and it's a month to month contract starting a very inexpensive and we also have the Data Self enterprise Analytics version which starts at 1499, about $15. It takes weeks to deploy but comes with a lot more things to learn more about the options, pricing, what comes I'm going to encourage you go to dataself.com going to show very quickly what where you can find more information about that. So let me go back to my web browser and go to dataself.com so if you go to dataself.com pick the ERP system that you use. I'm going to click let's say Acumatica and then this page is for Advanced analytics for Acumatica and then you can scroll down. There's a lot of information here. Description sample Dashboards if you want to see the sample dashboard for manufacturing, for construction, whatnot. So just click and you'll see some samples. Pricing for Advanced analytics is right here. And for products like Acumatica or products that are cloud based, the Deployment is usually 50 minutes away. You click, you go through this deploy analytics now and in 15 minutes pretty much you deploy the solution. It will come alive after the data has been loaded. So fairly straightforward. If you want to learn more about the enterprise analytics instead of the Advanced analytics, then you click Enterprise analytics and then you go to another page that has more description about Enterprise and You can have a little bit of education overall. Absolutely. Feel free to contact me to discuss what you're trying to do and see if data setup is a good fit. We make it very easy for companies to assess, see if it works well and if it works well we can help you shine with your reports and dashboards. If it doesn't work well, usually we'll stop before you invest. Even if you invest, we also have money back guarantee so we don't want your money unless you love us to that. That's how we do business. Having said that, we're running a little short on time. I want to be sure we address some of the questions that you might have. So if you do have questions, please use the Zoom Chatting box or Q and A box to ask questions and I see if I have any questions being posted. Yep, there's some questions here. Question from Carl how long does it take to deploy enterprise analytics? Carl, thanks for your question. So the enterprise analytics is the full blown, full fledged data warehouse solution. Typically it takes weeks. The basics takes about a week or so but usually tell people in a month. Within a month we have the system up and running with a bunch of customizations. Most people when they go to enterprise is because they have certain customization requirements that will take some time to set up. Typically within a month is when the solution will be ready for users to start getting value. The out of the box usually has value as is and within a month we can bring it up and running. Some organizations have a lot of customization, sometimes it takes longer, even several months, but usually in a month is we can bring value right off box. Carl, thanks for your question. Let's see more questions. Question from Hun or Jun Is this a separate reporting tool or is it an add on to Tableau or Power bi? Good question. Let me go back to the architecture to answer this question. Oops, I was right here. So Tableau and Power BI is part of the package. If you go with tableau then we have a embedded tableau version that you don't even know. Tableau is behind the scenes, it's just part of the whole package. If you use Power BI is usually use your Power BI licenses. But what DataCell brings to the table is a data warehouse that is very mature and very robust that is pre configured and pre mapped from all of the data sources. So right out the box we have a data warehouse with dozens, sometimes more than 100 tables pulling data from your system in an efficient way, automatically refreshed, security refreshed and then we have templates for Tableau or Power BI that on day one, once we deploy will give you a lot of reports and dashboards. Some people ask us why would I need Data Self if I already have Tableau Power bi? That's a good question. If you already have your Tableau Power BI working beautifully and is efficient, everything is working well. You don't need Data Self if you're struggling, if you're spending a lot of time, things are slow, they're crashing, you don't know which KPIs to develop. Well, we can help you a lot because in a matter of minutes or weeks or days, we can give you a lot of reports and dashboards ready to go deployed in with our expertise, we can train your team and we can help your team become a lot more self sufficient than if you start everything from scratch. So primarily that's the main difference. Another question here from June or Hun. Sorry if I don't know how to spell your name to pronounce your name. We have Saich enterprise intelligence reporting tools. Does your product work with sei? Yes and no. We have several clients that they came from the sci. They were worked with SEI before and those clients that left SEI was because SEI was too complex and it was slow, it was crashing. They moved to Data Self and they decommissioned sei. So some of many of these clients we were competing against sei, but we do have some clients where they're using SCI for the financial reporting side which is already working. Why change? And then they have added Data Self as a complement to focus on the operational set of reporting. So yes, we work with SEI in the capacity as a complementary tool even though the extraction process is kind of, you know, in a certain way in our refresh process of course now being, you know, my own opinion, but we have a more efficient way in more robust way to do data warehousing. That's what we do every day for 15 years. And our data warehouse is usually more robust, faster and easier yet to customize. By the way, I would encourage you, if you still have more questions, let's have a one on one call where we can discuss those needs and see if Data Self would be a good fit for your organization. That was the last question. So let me go to the last. Maybe I have another one here. Nope, that was about it. Let's go to the last page. So here you have my name, my email, my phone number, if you have questions, comments, if you want to discuss anything about bi. I'm a data geek I love talking about bi even if you're not buying data self, so feel free to contact me. I hope. I really appreciate your time today. I hope you have a safe, well, insane day and weekend. Thanks for joining. By the way, we're going to we have recorded the webinar and later today or tomorrow we're going to be receiving an email with the recording and you can forward to your peers in case you want to share what you learned today. Thanks for joining us. Have a great day.










