DataSelf for Manufacturing with Natural Language
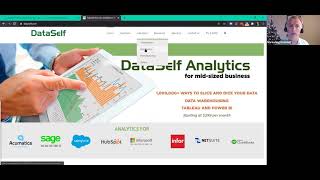
Johnny Girardi and Clark Walliser demo DataSelf, a platform that pulls manufacturing data from ERP, CRM, ecommerce, and spreadsheets into one place. It lets you query data in plain English, build dashboards in Tableau or Power BI, and ditch the Excel spreadsheets that slow down planning and inventory work.
Questions this video answers
January 28, 2021
Johnny Girardi (DataSelf founder & CEO) and Clark Walliser (DataSelf consultant, former ERP consultant)
About 30 minutes ("a matter of half an hour")
$299 (mentioned as starting price)
More than 20 different systems (they state DataSelf uses >20 systems)
Chapters
All righty everyone. Hello. Thanks for joining us. My name is Johnny Girardi. I'm Data Sales founder and CEO. I've been working with business intelligence solutions for mid sized companies for about 20 years. We'll be talking about how BI overall can help manufacturing companies and we'll also show how the Data Self does it. But hopefully you learn something from this webinar regardless of what BI solution you use. Clark, can you please also introduce yourself and turn the webcam on?
Greetings. My name is Clark Walliser. I've been at Datacell for about two years now. I come from a background of about 30 years working as an ERP consultant. Worked in first of all distribution, finance, moved into manufacturing, later years was focusing on manufacturing and moved into business intelligence. And after many years of discussing issues with Johnny, I finally drank the Kool Aid and came on board. I'm a happy camper here. So my focus is how people use their ERP and CRM systems and how to get information out of those in meaningful ways to make business decisions.
Thank you Clark. And Clark has been with VARs, with end users and now with Data Self and also working with many manufacturing companies. So he'll bring some good insights from being different places of the business in mid sized companies. Anyhow, let's move along and let's talk first of all, why many companies are looking for a BI solution to improve their manufacturing the decision making process around manufacturing. One of the good news is because companies have a lot of data, you know they have in the ERP system, in the MRP system. Actually nowadays, you know, if you're in this webinar, most likely it's because you use one of these ERP systems that I'm showing some of them. They have built in the MRP inside of them and you might be using them maybe as an add on, maybe as a third party component. But usually if you're a manufacturing company, you probably have a lot of different data silos. You know, you might have Excel for many reporting or data sources or maybe Google Sheets. You might use CRM like Salesforce, HubSpot, Sage, CRM, Mathematica, CRM. You might have E Commerce, you know, Shopify, Magento. I mean there's a lot of different data sources that people use to run their business data self alone. We are a small business. We have more than 20 different systems to run our business. And when we here are trying to make decisions of how we can better serve our clients, quite often we have to log to different systems and we have to do who has the credentials, how it works, we are bringing our own data into dataself but the reality is people have a lot of systems and it becomes challenging. We hear a lot of management saying that, you know, they have a data house divided, the data is all over the place and they are flying blind. They're making decisions based on gut feeling or based on some Excel report that someone put together is the right information. Is Excel refreshed? Is Excel go into the wrong hands? It's very hard to control information and seeing what's happening. So flying blind is a big challenge for many organizations. Some people say they have Excel hell. There's nothing wrong with Excel. Excel is a great tool. Excel hell is the concept of having reports built by different people using different tools. Sometimes Excel, sometimes reporting services or crystal or you know, let's say akumatica reporting different people working with different reporting tools and coming up with their own ways to define their metrics. And sometimes the numbers don't match and sometimes you don't know when the data was refreshed. So Excel hell is this natural way of progressing from a small business with some simple reports into a framework where many people are involved and you lose control of the information. So that's Excel Health. Also people complain a lot that this kind of framework with the Excel hell it becomes labor intensive. There's a lot of people all the time working to get the data to the decision makers. A lot of hours from technical people, from business analysts to validate the data to be sure the data gets to the right hands, the right time. Sometimes the reports are sent to the wrong people. It's labor intensive, it's very complicated, it's not effective. How can you address these issues? Typically a big chunk of the solution can be solved by using what is called enterprise reporting or enterprise BI solutions. I'll talk about data self as part of it as part of the solution, but you can use any enterprise level reporting platform to tackle those things. A big chunk of the solution relies on data warehousing. Data warehousing is a pretty mature technology where you pull the data from your data sources. Initially maybe only the ERP and mrp, but any data source can be your payroll, your Google Analytics, your Excel sheets, everything that is used for the decision making process you bring the data into. The data warehouse is a single place where you maintain your rules, your key performance indicators, how do you look at your, at your revenues, at your gross profit, at your friction rates. Everything is defined in a single place in the data warehouse. The data is refreshed automatically. Just computers will do all of these things that people do in Excel. Copy and paste. Nope, the computer does all of this crunching then if you use high end analytics tools like Tableau and Power bi, they are amazing at providing business users with easy access to their data. Using grid reports, dashboards, charts, very easy to interact. You can open mobile devices you can use in browsers, in Mac computers, any, any device, computer device, pretty much you can access your reports and KPIs and it's very secured if you use the right secure security dials. Even Excel. If you plug Excel to a data warehouse, you can eliminate the Excel help perspective because Excel is also a great tool when properly connected to your data sources. So Data Warehouse a big part of the solution for your Excel health issues. Embracing tools like the Blue or Power BI is also usually a great movement. There are some other vendors as well, but these two are the leaders. And with Data Self now I'm going to talk a little bit about Data Self. We do have this whole data warehouse, the Blue, Power BI and Excel as options and we have a lot of reports ready to go on day one. So with dataself, if you were to choose our solution, we can pretty much get you up and running in a matter of half an hour inexpensively and you can leverage this amazing technology quickly and easily anyhow. So that's typically how analytics can help manufacturing companies from a high level perspective. Now let's jump into the product presentation and during the product presentation a portion of it. Clark will take over. He'll talk about some use cases that he's been involved with in how BI has been helping those companies tackle manufacturing problems. But we'll go over first of all how a data house divided that I showed you before looks into a Datahouse United when you use a enterprise level BI solution like Data Self. So I'm going to show you that. Then Clark will take over to talk about some out of the box reports that we have in Data Self and many of them if you don't use Data Self, if you're not going to use Data Self, you can use those templates as inspiration to help you design your own BI solution. So look at some of those KPIs. We'll show how natural language, machine learning and artificial intelligence is helping clients getting data out of their systems for better decision making. We'll show you in Data Self or if you're using enterprise level bis, how to do customizations and how to do report distribution. So having said that, let me show the Datahouse United Framework using the data self approach. But again, any BI tool that is properly set up, you can do the same thing. So here when I log in, let's say I'm the CEO, the COO or the CFO and I have access to several KPIs of my business. I'm looking at sales. If I have CRM, can be Salesforce, Akumatica, CRM, dynamic CRM, Sage, it doesn't matter. It's a CRM system. Maybe an E commerce platform, Magento, Shopify, maybe I have marketing campaigns with HubSpot or Constant Contact, Google Analytics, inventory management, manufacturing, financials, payroll. No matter what you have what data source you want, you can plug to your data warehouse, you can plug to your analytics layer. And as a user when they log in, I see those areas and I just point and click and they can navigate to see what I care about. My my reports, it's very important to control the data. So if I'm the CEO, typically I only see high level things that I care if I'm a salesperson, usually I only see sales related information like you know, CRM, maybe commerce, marketing and sales. But I cannot see financials, I cannot see payroll. So your enterprise reporting platform should have a robust security layer to be sure that the right person will get the right data at the right time, seamless and automatically. So be sure to have those components as part of your BI journey. Today in this webinar we're focused specifically in the manufacturing side of the business, the producing new products. If you want to learn how data self helps your distributions out of your business, like looking at better sales analysis, looking at marketing, CRM, Shopify, all the things that are not manufacturing. I encourage you to go to our website. We have a page actually if you go to dataself.com, go to industries and you choose distribution. We have a webinar that shows all the goodies, all the good things that we provide for the distribution side of manufacturing. Having said that, I'm going to let Clark take over and show you the product presentation around manufacturing.
Thank you. Johnny. You'll need to share your screen.
I think I'm sharing my screen. I'm going to share the.
Do you. Have you given me control already?
All right. Yep. Gives my control to Clark. All right, see if you can move the mouse.
Okay, so if I were to click on something. Yes, it's now working. Okay, I'm going to start off with a little bit of my background again. I was an ERP consultant and I did a lot of this work Manually for my customers. And you know, as Johnny's saying, anybody can do all of this work. You can create your own business intelligence system. So the focus of what we're looking at today is kind of helping you what kinds of questions and things to look out for. Some of the driving forces for me coming to Data self was I got tired of rolling my own every single time. And every time somebody wanted to make a change, we had to go back to everything and check all the related stuff. It's a lot of work and a lot of investment. Whereas with Dataself we were able to, we have this built in platform turnkey operation and we had the foundation right there and that's part of why I'm here now. So we're focusing today on the manufacturing section. But first I want to point out the distribution side which is a different webinar feeds into this because in sales order, in the sales process, your missed shipments of what has not shipped yet that day and what's available to ship, that all feeds into the inventory planning. So these, all of these views are related and they connect together. So we'll start off with the example of the inventory planning to give you an idea of what it does. This is an example of the kinds of information you might want to look at and that you can do with business intelligence front end hooked up to a well designed data warehouse. First of all, grouping by product, very simple. Then grouping by week. In this case you want we're tracking our demand and supply by week. You can also want to make sure to be able to select am I looking at all my A movers, B movers or C movers? Am I looking at only certain locations or configurations and how far out am I projecting? And when you're looking into projected calculations, you might want to be able to look at that from different perspectives, factoring in different items. So these are the kinds of things you want to be taking into account. Obviously we're showing this because we've done it, so just give an idea. But we've got what's on hand today coming from all of the other related information, your demand sources, what's on work order or what's on purchase order, et cetera. You can also project what's on the water. You might have a location for on the water and want to factor that in when that's supposed to be due. You can look at your demands, what's on sales order or required as components for production, et cetera. And that would. And then if you have sales projections, these sales projections in this case can either come from your ERP system or from an external. Oftentimes people will have an external spreadsheet of their own sales projections and you want to include those into this data warehouse and view. Then you can get your on hand, your projected on hand and again this is all controlled by how you set up your configuration. The main thing is to say for each week how much are you going to be over or short. And then you can see examples when you're getting short. You want to make it easy to see the out problems. So changing the font, etc. That's the type of thing you want to do that's on the inventory sales analysis. Now this looks easy right here from myself as a consultant. Pulling all of this together was a, you know, a 30 hour project to make it all connect, all working efficiently and performing adequately. So it's, it's not easy to roll your own. Next item is looking at the, the bom. Actually I'm going to step back a step because I, I have a real life situation here. I talked about how many hours it it could take to do this on your own. We have a client that has had data cell for many years. The reason they did this is because they were, they got data cell phones because they were trying to do this out of their ERP system using crystal reports, SQL report design, etc. And they just could not get the information in a timely manner in the ways that they wanted to view it for quick decisions. So that's what drove them to using in this case data self a data warehousing system. Because now they're only pulling from the qualified data they put into the data warehouse and they are able to put their metrics right into the data warehouse. Instead of taking hours to run a crystal report to calculate everything every time they have it all pre built in and ready to roll. So it wasn't anything technically more than what they could have done straight out of the ERP system. But the timing, the performance was greatly enhanced with the ability to customize the input on what is a qualified sales order for demand. What is a qualified purchase order or production order controlling the supply. So that's a use case. This is an actual customer. I can't say their name but this is real life how they used it. The result for them was they could get the data they wanted, you know, in a way that they needed to make their business decisions. Next piece of manufacturing, you might want to see what's available. So this is now looking previously we were looking at just Finished goods of what's available in your inventory analysis. Now we're getting to it at a bill of material level and you can see which items are, you know which bill of materials you have, you can control which locations, et cetera you might want to do. So think about that. You might want to take a look at what types of if you have different BOMs for different purposes, take into account which ones do you need. Do you have live bill of materials engineering, BOMs, estimates, etc. And so the point here is you can go ahead from a bomb and drill down. For example, if I take an example of one BOM there it will drill down to show me only you want to make sure that you can drill down and show everything related in your different views. So interaction between your different widgets or objects on your dashboard, that's an important characteristic. Do you want to build into your views? For example, I drill down on this product and I can see that in here, I have these screws in here twice on different lines. And that's great, but how am I doing? This screw is used in multiple places. But then when I come down to my raw material view, I can see that I have a requirement of 559 and I don't have any available. So I can quickly look at from information from multiple locations and drill down to the to the view. To summarize it all together, another example is that on this bill of material where in this case the screws are listed twice, there I can also get a view of that same bill of material, but rolling up all the of the components into one level. So now I have that screw, even though it's used on multiple lines in my bill of material, I have that raw material summarized for that BOM at all levels. So the interaction between the different components to view elements in a summarized and detailed way. Also you want to take into account how many levels down do you want to be able to go on your bill of material. We've built this example to go to 5 levels, but some people use a 10 level BOM, et cetera. Make sure that whatever solution you have come up with can do that. And of course we would like to be able to say that be able to, you know, provide that for you. Also include drill down abilities to, you know, if you want to drill down and show other information related to that, make sure that you have the ability to drill down to deeper levels of detail on any view you've created. I'm looking at my notes here. This is a case where on my Second use case, another customer, they had some really critical needs because they have E commerce and they might get over 1000 sales orders in an hour through their E commerce system. And they had to build, they used kit boms and so they had to make sure that they had all the raw materials available to meet everything in a just in time environment. So they actually have data self instead of having the data just refresh once a night, they did their sales order data refresh every 30 minutes or so so that it would, you know, it didn't affect all the other pieces, but it would update their demand immediately so that they could quickly see how much and their demand on the inventory supply and in the bill of materials, what components they're going to be short of. So one of the things you want to make sure is that you have the flexibility when you're designing a system to accommodate immediate needs without quick without significantly impacting your ERP system. Another view when you when you're dealing, we've dealt with the inventory and the finished goods. We've dealt with to the boms for the finished goods and going down to all the components within them. Now we have a view of example. I want to be able to see what's on podcast for my demand of my raw materials, what's coming in. So this is an example of things to take into account what is late, what is future, what's due today. So make sure when you're designing your views that you have the ability to find those critical KPIs. Things that are late. I need to find out why they're late and how much that is impacting my process. The other things you can make sure that you have the, that you have the interactivity. There's a particular part number I'm looking for in here. I'll go ahead and search for it and make sure that your views have the ability to be able to search this way a sort and quickly find them which I lost it. I'm looking for a part number called Conbaby3.
And it's right typically Clark, there's a prod ID description on the right as a filter that usually can quickly also find items.
Good, that's good point. Make sure you learn how to use your views adequately. Okay, but these are the kinds of pieces of interactivity that we want to make sure of. This particular product I can see right here by clicking on it. With the interactivity I can see that I buy it from two different vendors. It is one day late and it is only on one purchase order. So Maybe if it's late and I need it quickly, maybe I should go to the other vendor and I can get it more quickly than the vendor that's on. So these are the kinds of things you want to be able to make sure your BI solution will do. It shows I have 15 on order, but it's one day late and so I can act on that. The another view just to take it down to the production level bill of materials. You might on your system, you might do all of your production entries through bill material. You might have a work order process or production order processing system. So make sure you have views to be able to look at the information from a work order level. You might want to look at things from a process step level or from different operations and see what's in common to find out what are your bottlenecks, et cetera. And you want to make sure that you have the. You want to make sure that you have all of the interactivity. So if you were to click on a work order or a production order, it would show only the information from that. Things like this can get very complex to design for yourself. Make sure that you have the ability to filter out. I don't want closed and completed orders in there. Maybe I don't want estimates in there. Make sure that you have all of that interactivity to show only the information you want to look at. So that's, that's where I am right now on that. Wanted to kind of, I guess. Johnny, I'm ready to turn it back over to you.
All righty, thank you Clark. Appreciate it. So Clark covered some more detail oriented reports that typically manufacturing companies, people use bi to do better, you know, manufacturing, planning and execution. What I'm going to show you next is this dashboard, the number 39 in our list here, which is usually a more high level management kind of dashboard. In management, usually they don't go down to the detail level to see the bombs and whatnot. Those are for the people executing manufacturing. Management usually wants to see the big numbers. Like in this case, let's say units produced and how many were lost. Then you can see for every product, the bars is how many you produced in the dos is how much percent of each of those products were lost. So you can see some trends and why some items have such a bigger loss than the others. Typically management also cares about the operators, the people who are in the production and see how effective they are based on products schedules and whatnot. So there's usually also in dashboards you can also plot ways to manage operator productivity. Typically they also want to see data coming from other systems. In this case we're looking at open sales orders and which items you're supposed to be shipping and are you in line to deliver them and if you're not going to deliver, going to be late, should you call the customer and try to manage expectations. So high level management dashboards like this one are usually highly customized because every business they have different needs management have different needs of how they want to see their manufacturing business. But when you use an enterprise BI solution using templates or building from scratch, you can give management access to their KPIs anytime and anywhere. So what we just covered is the kind of some of the KPIs for manufacturing and we showed some of the things we do out of the box with dataself. As far as template goes, what I want to show you now is some of the customizations that we see clients doing in enterprise BI solutions. If the clients use data self or if you use a BI solution that has natural language functionality that's become very popular. Let me go back to my original entry level page. Click and show natural language and how it works. In my exercise today I'm going to show natural language out of sales. But any data that is in your BI platform, you know that you brought your data warehouse that you have plugged to your things like Tableau Power, bi. Even Excel today has a little bit of natural language. I'm going to show how easy it is for management to get answers to their questions without knowing BI tools. We're now knowing editing of BI tools. It's just using English. Plain English. You need to know English. But if you know English is like searching the Internet where the result is a report, not an article. So right now I am looking at my my sales natural language functionality. Let's so let's say I'm the VP of sales and let's say I want to see sales by salesperson in 2020. Probably you already have this report but let's say that right now I'm busy. I don't know what the reports are. I'm just going to see this answer. I could go here and say sales by salesperson in 2020. So I plain right in English what I want. The tool will use natural language, machine learning and artificial intelligence to try to understand what your question is. See if you can find an answer and then give you hits. Like in this case he gave me two ways to interpret this question. You have to choose which one is the right one. Just like when you search the Internet, you find a bunch of hits. Which one you want to pick? Well, pick the one that you believe is the right one and the tool will build instantly accurately an answer to that question. So in this example by salesperson, I'm seeing sales in a descending order in 2020. Some people say this is magic. No, this is not magic. This is artificial intelligence. Machine learning, helping humans get better information out of their systems in natural language for reporting is a fairly new technology. It's about five years ish old, but it's amazing how much things you can do, you know, let's say if I want to see by month, I type in by month. The tool again gives me options. I choose the right option and now I can see by salesperson. Give me a line chart with different colors and I can see in 2020 by month sales for each salesperson. It's amazingly empowering. Many people like to see numbers, not charts or different representations. Sure, I can come over here and say show me this as let's say a text table which is like Excel. So if you like numbers now you got them by the penny. And maybe you want to export information out into Excel or other tools. If you're right using the right tools, you can easily do it. Like with this framework, I can pick whatever the data points that when export to out. I'm choosing all the sales by salesperson. In January I tell the tool show me the data because I want to export it and then it shows me those data points and maybe I only want to export this to Excel. Or if you want to see the underlying data, you know, all in this case, you know, invoice number, invoice line items, everything I can tell the tool show me the full data with all the records. So now I'm seeing every record, every piece of information for my sales. I export and now I get into Excel. If you were to be doing this from your manufacturing data, then you can have all of your work orders or your bill of materials quickly export into Excel. And now if you want to do something Excel, it's quick and easy. These platforms provide you the way to give decision makers without training knowing English at least ways to find answer their questions. Just using natural language and quickly exporting the data into other formats. The next part here I'm going to call Clark again. He's going to show how easy it is to build. Actually I have to delete some stuff. Clark, sorry, I forgot to delete the prior demo environment. You're supposed to start with a blank sheet, otherwise it's going to be too easy. You got to show it how to do it. So Clark was going to show in data self and we actually leverage tableau. How easy is to build a more complex report, a dashboard that natural language cannot yet fulfill. So Clark, take it away.
Thank you. So the point here and do I have control? Yes. The point here is whatever business intelligence solution you come up with that you design, you want to make sure that it's easy enough to get the data out in your own ad hoc queries. Johnny just showed the natural language query. That is one way to do this. What I'm showing you now is how you can build your own reports. So the three leading BI tools that people are using are Tableau and Power BI and Excel. And so whenever you're doing these things, and incidentally all three of those do have natural language query built into them now even Excel does. So those tools are very useful. And here's an example of building some basic reports and views in Tableau. And this is the kind of thing you want to make sure you can do easily. I'm going to start off and I just want to drag on take my customer and I want to see a list of all of my customers and then I want to see a list of all of my products that they have purchased. I just drag those up and bing, it's right there. Then I might want to see what are their sales. So I can just go ahead and take my sales and bring it into the report canvas and I instantly have a list of all of my it's grouping by customer, all the products that they've purchased and the sales dollars for that. If I want to go ahead and put date ranges on this, I might say I want to go ahead and filter by my document date. Now it will go ahead and filter and then I'm going to go. You want to make your filters easy to use. So you want to make sure that your configurations, your choices on your on your system are you can be controlled easily. I'm going to say I want to see only data for the last three years. So control simple tools for selection criteria, simple tools to drag and drop. Give you an example. I'm going to create another sheet and show this. This time I want to see sales. Just want to see sales and I want us to see my sales as a chart by month. So I'll go ahead and you want to be able to create a column for each month and it automatically does it in year. I'll go ahead and change it to be by Month. These are the kinds of features that you want to be able to have access to easily. Now give you an example of how you want to make sure and take it to the next level. If I also want to be able to see not just my sales, but my gross profit, how I can now see two views of the data, you know, from different angles you have the ability to go ahead in this case Tableau or in Power bi, they pre build the templates for you so that you can come up with the view that is most useful to you. One detail I'm going to make is. The other thing to take care to take into account is that I just did something weird there. Okay, My duct tape is for last three years. What I've just done is apply this filter across all of the views. So whatever BI tool you're using, make sure it has interactivity across the board. The last step is I now have two views of data. I want to put them together. Put you can create in this case Tableau or in Power bi, little harder in Excel to go ahead and create a dashboard linking those views. That can be a little more work in Excel, but in Tableau and Power bi, pretty simple. Now the point of all of this is that when you have created this and you save it, other people can use it. I was in the edit mode, other people can use it and, and now when I'm looking at this, I can go ahead and select only certain date ranges and it will adjust my numbers according to the date ranges I have selected. So be careful, make sure that you have the interactivity that you need, not just a half a solution. So in less than five minutes, I created a solution that showed me my sales by customer and product, also my sales by time, and connected the two into a combined view that is interactive. Make sure that those features are available to you when you're designing your BI system. Johnny, back to you, Clark.
Yes, perfect, thank you. One of the things that I hear often in clients that they come to data self is and they see this kind of interactivity, you know, quickly you build something, but then when you give to management, they can quickly click in some of the sections of their reports and dashboards and it filters the rest. Or they can click and drill into the detail very easily without knowing complex things. That seems to be a very compelling value that most ERP and MRP systems out there don't provide. You know, usual reporting, you got to call the consultants. You got to build something that is kind of clunky. It works, but it's Kind of limited. People need power. People need to be more, you know, more empowered to make changes on the fly. And using tools like this tableau and power BI goes a long way to support them. The other thing that is also very popular is report distribution. You know, let's say Clark build his report. Let's say that he built it for me, like for my sales team. I look at the report. Awesome. You know, I love it. Now I don't want to go to the report. I want the report to come to me on a regular basis, every day, every week, every month. So how can a system like this automatically render reports to people in their own preferences? Some people like to go to the dashboards and see what they want. It's called the self service approach. Some people like to be receiving reports when they want. There are two main ways to receive reports when people want. One is on schedule. Let's say I want to receive this report every Friday. I can do it myself or the IT person can do it. You know, you click the subscribe button, you tell who should be receiving this report. So in this case I'm doing myself. I want to receive and Clark is going to receive it as well. And you can put all the people that you want on this list. You just pick and choose the people you tell what should be emailed only this view. It can be a workbook that has several reports like financial reports for your board members. You want to send it once a month, once a quarter. You can set them up in data self, tell how often to send and automatically it will take the whole workbook with all the tabs and send to these people. Do you send it as a PDF? Sure, let's do a PDF. You can give a name to this email and how often you want to send. You know when I send daily, monthly, weekly. I'm going to say weekly, Friday 4pm and you press subscribe and that's it. It's that simple. You can automatically start sending reports to people. The other approach that I'm not going to show here is only send me a certain report or a workbook if a criteria is met. For instance, I only want to know if orders were not shipped yesterday. If something was not shipped, I want to know if everything was shipped. I don't want to know. Don't even tell me, I don't care. That's called alert. And when you use enterprise BI solutions they all have powerful built in functionalities to send only notify you when criterias are met. So that's also pretty interesting already I think we covered all the topics of our, of our product presentation at this, at this level. Let me go back to the PowerPoint and go to the next slides. If you were to go with Data Self, some of the things we show you today, some and I'll talk more about which ones we do include and which ones we do not include in minutes. Some of the features that we show today, literally in about half an hour you get a Data Self up and running. And yes, you get a data warehouse, you get tableau and you get a lot of reports and dashboards ready to go after about 30 minutes of deployment. And you do not need to have anyone highly technical. It's a fairly simple process. You order Data Self through your var or through dataself.com and pretty much there is a quick wizard that you go through and you have to check security where your data source is. So usually the half an hour is to be sure you fill out the five steps that I show you here. Once you do that and you press save and finish the Data Self out of the box solution would be completed if you were to watch the distribution side of the webinar that, that you know to cover the distribution side of your business. Pretty much everything that is showed in that webinar is available right out of the box for manufacturing. We'll talk a little, a few differences in a minute. So deployment is very straightforward. We have the Data Self ETL plus tool is a fairly new product. You know, We've been using ETL, our own ETL technology for 15 years and ETL plus is the latest and greatest. ETL stands for extraction, transformation and loading. It's an easy, fast and powerful way to do data warehousing in our ETL is amazingly simple. If you know SQL statements kind of technology, you can do magic. You can be a data warehouse person knowing the basics of ETL processes. So very simple to deploy to maintain pricing of Data Self. So Data Self has two editions, the Advanced analytics and Enterprise Analytics. So far all of our clients that are in the manufacturing business, so potentially all of you in this call, they all went to enterprise right off the bat. And why they did not use Advanced analytics is because they want us to customize the manufacturing analytics. You know, the work order, the bill of materials to their specific needs in Advanced analytics does not provide, did not provide it to them the things that they needed. So they all went to the enterprise level. Now don't despair, we have a lot of manufacturing clients that they do not need bi like we showed you today, out of Their manufacturing, you know, they have an MRP system, they have some kind of reporting that is that they are happy with the manufacturing processes. However, they need better analysis out of their sales, their inventory on hand, their purchasing, their receivable, their sales or financials. So for the distribution side of your business we can absolutely start with advanced analytics and a lot of clients go in that direction first. It's very inexpensive, it takes half an hour to get it up and running and we even offer a free trial. So great way to see if the enhancement in the non manufacturing can be tackled by data self advanced analytics. And as you learn the possibilities and you see the power, if you think you want those ad hoc possibilities into the manufacturing side of your business, then potentially you can go enterprise. We are assessing if we can make advanced analytics cover more enterprise. I'm sorry, we're assessing if we can make advanced analytics be more powerful for the manufacturing side of the business. I believe we will do that. But in the meantime keep in mind if you want better manufacturing right now all our clients have eventually moved. I mean sooner than later they moved to enterprise analytics which is significantly more expensive. So that's about pricing and I'm going to open the Q and A. But before we go into that, just to give a quick overview of the things we discussed today, the first thing is the concept of using enterprise reporting in BI to get your data house divided into a datahouse united and how easy it becomes for users to find their KPIs anytime, anywhere. Building key performance indicators quickly and easily is paramount to get traction with your users. With dataself we have about 100 and so reports and dashboards out of the box with advanced analytics if you go with the enterprise we have more than 5,000. So there's a lot more out of the box if you go with data cell. From a KPI standpoint, this kind of technology, it's amazing to automate complex and labor intensive reporting tasks. So things that people are doing repetitive today, using Excel, increasing whatnot, you should let the computers do it. Data warehousing and tools like tabooing power, BI usually can offload people from those repetitive tasks. I encourage you guys to embrace natural language, artificial intelligence, machine learning. It's a journey. There's a lot of things you need to know to be successful. One of the biggest limitations of this technology right now is it assumes that the people know how to ask the questions. And when the answer is complex, quite often people don't ask the right question. They get an answer and they think the answer is answer their question, but it's not because they made a question and they didn't articulate articulated correctly. The computer answered that question. And people make decisions based on the wrong information. So natural language is amazingly powerful if the people asking the questions can articulate the questions correctly and understand the computer's answer. So again, I always tell people it's like magic, but many times if you don't know what you're doing, it might not do what you think it's doing. We have clients that are using successfully, but again, you got to know what you're doing. If you go with Data Self again deploys in minutes, usually in 30 minutes is the time that it takes to deploy Data Self and the starting price is 299 already. If you have questions or comments, please use the Zoom panel. It has a chatting box and a Q and A section. Let me bring it up here to see if we have any questions. And Zoom changed the way that they put the questions. All right, we have a question from Carl. What is the training process for Data Self? Carl, thanks for your question. Training is such a fun project for us. Let me tell you why. We have several clients that we deploy out of the box. They watch videos, they read documentation, they watch our webinars. There's a lot of self service training materials around Enterprise BI solution out there and we have many clients that they got zero training from Data Self and they became very successful. It's possible. Most clients we encourage at least eight hours of training to learn the basics of the user interface reporting, in our case tabloid power bi. So on average 8 hours will take someone that knows very little about reporting and become fairly self sufficient in building and customizing their own reports. That covers the 20% of the features that people need to build 80% of their customer reporting needs. So it's amazing. Eight hours go a long way. Now there are many clients that want to be completely self sufficient. They want to learn data warehousing, they want to learn etl, the backend, the server. There's a lot of different components in Data Self and sometimes it's never ending learning. You know, I've been doing this for 15 years and every day I learn something new. So it takes a lot more training. On average we recommend 24 hours of training for learning the backend, the basic of the backend. And again, some people need less of that, some people will take a lot more to become self sufficient. But anyhow, no training. Eight hours and 24 are usually the beginning package we provide for people to start venturing into becoming data geeks themselves. Carl, thanks for your question. Let's see if there's any other question. I don't see other questions, even though I'm having a hard time opening one of the zoom panels. If someone is asking a question and we have an answer, we'll get back to you. So let me go to the last slide. This webinar is being recorded and by tomorrow you should be receiving an email with the link to the recording session. Feel free to share with others and if you have questions or comments about BI overall, not only about data self, but anything and you want to talk with us. We love data geek talk, so feel free to reach out. You can find here my email as well as Clark's in our phone number. I hope you have learned something interesting today. Thank you for your time and have a great day. It.










