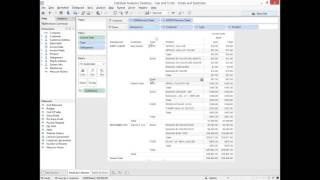
Learn how to add, position, and remove grand totals and subtotals in Tableau. The tutorial covers enabling column totals at the top or bottom, creating subtotals for each category level, and toggling row totals and row-level subtotals like quarter or year breakdowns.
Chapters
This video is about how to create totals and subtotals with data self analytics powered by Tableau. This is a simple report showing right now sales by salesperson, grouped by customer, by product type and by product in a given month. What if I want to add a grand total to the bottom of this report? It's very simple. You go to the analysis menu, choose totals and choose show column grand totals. And there we get the total for the column. What if you want to put the grand total at the top of the sheet, not at the bottom, Go to analysis, choose totals and choose column totals to top. And now we have it at the top. Sometimes that's useful. Let me go back to the bottom because it's more standard. Now what if you want to add subtotal to these different subcategories? Subtotal by salesperson, by customer, by product type. Same idea. Go to analysis totals and now you choose add all subtotals. So now for each categorization you have a subtotal. Now when you do subtotals like this, sometimes you do not want to see some of the subtotals. Let's say suppose I want to remove the subtotals by the customer categorization. Then what you do, you come to the pills here on the rows and columns, you select the item that you don't want, click the arrow pointing down and uncheck subtotals. So now I'm removing the customer subtotal. And if you look at that, now I no longer have the subtotal for customer, I only have for product type and then salesperson. Now the same ideas that we did, that I just did with the columns, you can also do with the rows. This is another report, an even simpler report. I already have the grand total by the column. But if I want to add the grand total by rows, I do the same thing. I go to analysis and I choose show row grand totals. I can put them on the right or I can put them on the left. Let me put on the right right now. So right now I'm just adding rows and showing the grand total on the right. And by the way, in this case, because I have the column grand total, I can see the total amount for the whole sheet when I have both of them together. If I add the subtotal using the same approach. Now what I have is I have the subtotal by quarter and then the subtotal for the year and the grand total in here. Again, if I want to remove the subtotal by year, I can uncheck the box. And then now I only have the subtotal by quarter and then the grand total on the row level. I hope you found this video informative. Thank you for watching.