DataSelf Webinar "BI Beyond Reporting for Sage Pro"
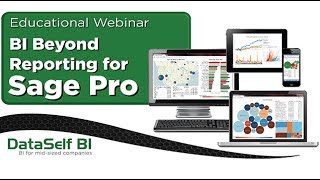
DataSelf founder shows how Sage Pro users can move beyond standard reports with Tableau-based analytics, a lightweight data warehouse, and roughly 2,000 pre-built reports and KPIs. The webinar covers role-based security, interactive dashboards across devices, and deployment options for mid-market companies.
Questions this video answers
About 2,000 reports, dashboards and KPIs.
Over 70% of reporting needs without calling IT.
Hours or days of effort; typically installed and operational within 2–3 weeks once server access is provided.
About 4–6 hours of training on average (some users self-learn via videos).
Low five-figure turnkey investment (example cited: ~$15,000 for five users).
Chapters
This is John Egiordi with Dataself. I'm the founder and CEO. Thank you very much for joining our bi. Beyond reporting for sagebro, we have a fairly good attendee list today, so I'm very pleased with that. We're starting exactly at 11:02 Pacific time, so let me get just the next slide over here. And probably we're having such a good attendance because many people in the Sage Pro community is going through a question and a decision of moving to staying with Sage Pro for a while or moving to a different accounting package like sage 100 or sage 300. So some of those questions you have and reporting can actually help you a lot, can help a lot with the decision if you're going to stay or if you're going to go and how you can either stretch your investment into Sage Pro, getting better information out of Sage Pro, or even helping you transition from Sage Pro to another package. Some of the topics we're going to cover here today are going to be addressing those. And throughout the presentation I'm going to give also some insights as far as how this technology can help you either stay longer with sagebro, taking advantage of your investment, or helping with the transition. So let's get started. Our agenda, we're going to be talking for about 15 minutes about the Data Cell BI technology business value. We should spend about 35 minutes viewing the product, a presentation and then we should have about 10 minutes for the question and answer section. So why are we here? Well, in a nutshell, most likely you have reporting challenges. You may be using traditional reporting tools such as the built in from Sage Pro, maybe Crystal Excel, Access and all of these technologies. You can do the job really well, but you have to be fairly technical and have to understand really well the database structure of your Sage Pro to do the job. Making a long story short, it's very labor intensive. Business people, the guys who need reports often cannot do the job themselves. They have to rely on someone else. And most importantly, it takes a long time to get those new reports or change the reports. So very often management need to make a decision now, they need new information now, but they cannot get a new report. They just have to use whatever they have in their hands to make decisions. So not the best informed decision. Welcome to GoToMeeting. There are four other callers on the call. Often, you know, running reports using traditional reporting takes too long. Too long can be 30 seconds, can be a few minutes, can be hours. It doesn't matter if it's taking too long. That's A challenge that. Welcome to GoToMeeting. There are four other callers on the call. The main reason in a nutshell is to empower the business users. They are the people needing the information anytime, anywhere and often they have to rely on it. So empowering business users to become more self sufficient to, to be able to get information when they need whatever they are, is the main purpose of business intelligence. And that's what we're going to be talking about here right now. So what are the main benefits from a very high level from Data Self Bi? Well, we have been doing this business for about 13 years now and working with Sage Pro for about that time. And one of the main benefits is with DataSelf, BI users can tackle more than 70% of their own reporting needs without calling someone else, without calling it especially. That doesn't mean that everyone is going to be doing it. Sometimes business people are too busy to learn the tool, but they'll have someone close to them, an assistant, a co worker that will be able to do this kind of analysis and find reports and slice and dice reports as needed very quickly, usually on the fly. That's our track record, over 70% empowerment. Also, most queries in Data Self BI, regardless of the size of your database, will run in seconds. That's also a major benefit. How do we do it? How do we make this happen? Well, there are pretty much three different technology components working behind the scenes to enable that kind of functionality is the analytics, the data warehousing and the out of the box solution. So let's talk about them. Analytics. What is analytics? Well, in a nutshell, making a long story short, analytics is a technology that was designed, a reporting technology that was designed thinking about business people. These guys, usually they're not IT savvy, they just use emails, browsers, simple things. But they need information, they need to grab data. So this technology analytics is designed thinking about being super intuitive, super easy to use, that any business person that is willing to give it an effort, most likely they can do it. So that's the core focus of analytics. Second is easy to collaborate business people all the time. They have to talk with other people, share information, discussion, send by email or go to a report, make some notes, send to someone else to ask the opinion or to ask their insights. So easy to collaborate, easy to share. Information is also a critical component of analytics. So that's on the presentation layer and we have, as we're going to be showing, very easy to use, very intuitive analytics solutions. The second component, working Data Self BI is what we call the ultralight data data warehousing. In making a long story short, it provides two main benefits. The first one is it tackles the following situation. You know, you go to a meeting with a few people to discuss your business operations. Each person comes, you know, come with their own reports. And often those reports were built by different people or they were built using different business rules. The way that you're looking at the metrics, the sales, the growth, the profitability, the quantity shipped, the man hour, whatever, may not necessarily be the same rule applied across all the reports. So as your team discussing what to do, they're actually comparing apples to pineapples and making decision based on not the one version, the truth. So a data warehouse is a backend. It's a server side technology, BI technology that allows the company to keep a one version of the truth. So the calculation, let's say, of your sales, of your returns, gross profit, whatever you're calculating is calculated in a single place and everyone pulls from that place. So everyone is sharing and discussing based on the single version of the truth. So this is one of the most important benefits of data warehousing. Second is very often people have very sophisticated reporting requirements and challenges and they have to combine data, merge history from different systems. The data warehouse is the database that has been optimized to tackle these more challenging requirements. Like for Sage Pro, maybe one of the challenges you're facing is, well, you're going to be migrating to a different accounting package. Maybe now, maybe in a few years. How are you going to be able to do historical analysis from Sage Pro with the new accounting package? Usually you don't transfer history, you only transfer the customer list, the product list, the GL list, things like that. Well, with data warehousing we can actually combine the history, your sales history, your GL history, your inventory history among different accounting packages, even if you transition from one to another. And that way when you're doing analysis in your BI solution, you can see your whole history. Like you never change your accounting package. And actually this is one of the most important benefits we're seeing for people moving from sagebro to another package is the ability to keep your historical information for reporting purposes, even when you transition to another accounting package. That has been a big selling point for us lately. The last value we have which is really important is the out of the box templates or the out of the box solution. When we install Data Cell bi, if you're acquiring our whole solution that includes all the modules, there are more than 2,000 reports, dashboards and KPIs ready to go like in a few hours, usually in a few days. We installed this great easy to use reporting solution. It's not only a reporting solution, but it comes with a very comprehensive list of reports and KPIs built in. And when I go to the product presentation, you'll see some of them. This slide is a little thick, but it's very good to have an understanding of where we stack when it comes to the analytics BI market landscape. So here we have on the left an arrow pointing to the upper you go. It's easier to use, faster to run, better collaboration capabilities. However, you're going to be putting more money into it. So in the bottom 80% entry level, as we call most of the BI vendors that you may be familiar with today, they sit on this bottom 80%. They are great solutions, very affordable. We call the, the bimmers, the Mercedes, the Porsches. Affordable, inexpensive, not the easiest to use, not the fastest to run. But if your needs are not that sophisticated, they are great. Go for them, check them out. We sit on the top 20% and companies that are in this top 20% are typically QlikView and Tableau and we actually use Tableau. Both Qlikview and Tableau are public companies. They have the stocks, they went IPO actually recently, very successful IPOs both of them. And we are also part of the top 20% because we use Tableau as part of our engine as we will see down in a few slides. But we target the more easier to use, faster, easier to collaborate, really empower business people to take ownership of their analysis. Now why we think we're even better than Qlikview and Tableau. Well, if you look from a turnkey cost, you know the cost is going to take you to install, to customize the solution for your needs to get training, to get up to speed. When you look at that cost versus how fast is going to take you to get to that point. Pretty much everyone else has a very variable cost versus a value out of the box because we have the 2000 reports in KPIs out of the box. Our out of the box value is so much greater than the other guys. Our cost is not the smallest but it's the greatest. We sit right in the middle. We have designed our business and our technology for the budget of mid sized companies. We deliver great value out of the box for the right pricing. So that's our vision as a company. One of our visions as a company. This slide is a little bit technical, so I'm just Going to give a very high overview. This would have your Sage Pro. Maybe when you migrate you may be having other ERP packages. We bring the data to a SQL Server data warehouse in a fairly code free environment. Then we push to the analytics component which can be on premises or in the cloud. And at the end of the day users can access it through desktop, web and mobile devices like tablets and smartphones. Very empowering for people to get information anywhere, anytime. Alrighty, we're right on track. So let's go for the product presentation and I'm going to cover three main points in my presentation. First I'm going to be talking about secured access and collaboration with data self analytics. Then I'm going to show out of those 2000 reports and KPIs I'm going to show three just to give an idea that they can be really insightful. The third part, which I believe is one of the most important is and it's where most of the other BI vendors don't spend much time is build something from scratch right here and show me. Show you. That is something that you can take ownership in case you decide to do yourself. So that's what I want to have you walking out of the session. If you want to do it, you're going to be able to see yes I could. Maybe I'm too busy, but I could. So let me get out of the PowerPoint and I'm going to switch now to the browser. So this is the most popular ways that people access or consume reports from dataself BI pretty much everything I'm going to be doing in a web browser can also be done on mobile devices such as tablets and smartphones. So here, you know, I log into this portal, there is user credentials, you know, right now I already have logged as Johnny Girardi and then I go to this portal. When I log in, the tool checks who I am and give me access to my dashboards. So let's say if I'm a salesperson I would have the sales team dashboard. If I'm a financial person I would have the access to the financial dashboards. So the first security level is what dashboards do I have access to. Now there's an additional security level which can be really critical. Let me open one of these dashboards to give an idea about that. I'm going to open this dashboard and here what happens is in this little scenario that I'm playing, I'm Johnny Giorardi would be the responsible for the West Coast. Probably you cannot see here, but this is west, it's west coast sales. So when I open this dashboard, which is the same dashboard for all my sales team, I only see my own sales, my west coast sales. If I were the big boss, the VP of sales, the CEO, whatever that has access to the same dashboard as everyone else, when this person clicks the same query, what this person would see is this. All the regions would be available, all the aggregation for the other regions. And now I could slice and dice it as the big boss and change these things, how they change. If I'm not the big boss and I only have access to my west coast, I cannot even see the other regions, the other salespeople, whatever. I can only see my own information. So security works really well in that perspective. Now let me show some of the out of the box KPIs that come pre configured in. What I'm going to be showing here is pretty much customer analysis KPIs. We have KPIs all over the place. Inventory KPIs, purchasing KPIs, AP, AR, GL, labor KPIs. We have KPIs and dashboards all over the place. But for the presentation I'm going to only focus on customer KPIs because usually something that anyone can relate to. So let me show some examples of KPIs here. The first one is a very simple one just to get the feet wet. I'm looking at my top performers, in this case my top customers by sales this year to date. So the size of each bar here relates to sales. And I have the numbers here in thousands of dollars. And in the top I have the gross profit and I have the circles representing the profitability. I also have the colors of the bars showing profitability on a color schema. So very insightful, very easy to see sales and profitability. Now this kind of dashboard is not a big deal because most people keep track of their top customers, top products, top whatever territories that they have. So let me take a look at some other more intriguing KPIs. This one is the most popular we have. You know, know your top customers is something that you usually do. However, keeping track of the top customers by sales change since last year, to date or last quarter, last month, whatever it is. But looking at the top change can be very critical. Here we have, you know, sales change this year to date, minus prior to date. And these customers are the one growing the most since last year. This is awesome. I'm very sure salespeople are on top of these guys because hey, they're growing, they're calling back, they're placing orders, most likely. No, these guys are really well served by your whole team. But how about these guys? These guys have major sales declines since last year to date, or you know, any period that you're looking at, in this case, year to date. What's going on? Are you aware that they're going down that much? Is there something that you, as a salesperson, as an organization can do to reverse a trend? Well, to answer that question, you have to know who they are. And quite often when we show this dashboard to clients with their own information, often they realize that some of these top declines, nobody knew they were declining and there was something wrong that they probably could fix it. So showing trends like this are critical. And we have several dashboards like this showing important information that should be paying attention to. Just one more example before you get too bored with pre configured reports. This is another kind of report looking from a customer standpoint and can be also very critical. This list show customers with no sales in the last 30 days. Assuming that you have recurring customers, maybe you are a distributor, manufacturer and you have customers coming all the time. Why? These customers have no sales in the last 30 days, but yes, in the last 60 days. So why are they no longer buying? This is called exception reporting, showing things that are no longer happening. And sometimes that can show you very important trends in your business that again, you should be paying attention to. All of these dashboards are fairly intuitive. So let's say if I were the guy here and I want to see only for this region, who are the customers that are no longer buying the last 30 days? I can select that with my mouse or with my fingers if I were on a tablet or an iPhone. And these are the customer from that particular region that have no sales in the last 30 days. And these are the product lines that they're purchasing. And then I could call the manager or I could go one by one and check what's going on. And then I could even come back here and say, hey, Mr. Salesperson from that territory, why is this not happening? And you add, and then you send an email to the person, hey, check out the dashboard. Then the salesperson opens the dashboard and sees the notes and then can collaborate easily. And this can be done again on a mobile device, on a tablet. Very easy to analyze your data, very easy to share and collaborate with other people. All right, so this was the second part of the presentation. So I showed security, I show collaboration and some of the KPIs out of the 2000 and how intriguing they can be. Now comes the most important thing in the long run, business needs change, business evolve. And it's likely that you need to be able to modify reports and building ones from scratch on an ongoing basis. You or someone close to you or to your management. So let's see how easy that is. So let me switch now to my desktop client. And the desktop client is the tool that allows a person to build reports and dashboards and publish them to the web. And what I'm going to be showing here, it's a fairly sophisticated dashboard. It's not something super easy, it's something interesting, intriguing. And my, my main idea here is to show that it's easy. You do not need to be an IT person to do this. If you as a business person, as the CEO, as the salesperson, VP of sales, you want to do yourself, you're going to be able to walk out of the session and say, yes, I can do it, I'm too busy, but if I want, I can do it because it's that easy. So let's take a look at first how this tool works. Then we're going to build a new dashboard from scratch. So first of all, we have this data panel. The data panel is where you find your reporting metrics. And right now we're looking at the sales details reporting metric. This could be GL reporting metrics or reporting components. It could be purchasing, payables, receivables, you name it. But right now we're looking at sales. Here we have a list of dimensions, what kind of entities you want to analyze your business by. So if you go to the customer and you expand, you see customer related sub components. If you go to the product, you go product related subcomponents. Now one of the interesting things that is helpful to get business people empowered by a tool like this is to help them on the fly figure out how to do things. And this tool has several features in that regard. One of them is, let's say if I look at this list of reporting components and I say I want to use the account manager associated to my customer to build a report like that is that the salesperson? So I put the mouse over the salesperson reporting component and then I have this pop up window saying, well, the salesperson is the rep recorded on the invoice table in the invoice header table. That means last year if I have a different salesperson assignment, then I'm not going to be able to analyze that information. Because what I want to see is using today's assignment. So if I'm Joe that I had taken over California this year, but I want to see my sales even last year from California, from the old salesperson, because now they're my accounts, I want to see those as my accounts. So this one would not be able to show because the salesperson from last year would be the one owning each invoice. However, if I go to the customer list, I have the account manager here. And this one as the pop up window shows is the rep currently assigned to the customer. So this would be my reporting parameter to use if I want to do a salesperson analysis based on the assignment currently on my customer table. So these pop up windows can help people on the fly figure out what these reporting parameters are and make this like a self help framework. At the bottom we have the measures, you know, the sales, profitability, whatever you're calculating, you're going to see the numbers at the bottom here now. So let's build a new dashboard from scratch. I'm going to make a dashboard with two main components. I want to see sales and gross profit by salesperson. That's going to be one part of my dashboard. And the second part of my dashboard is going to be sales by geography. So I want to see a map showing sales somehow. So let's build this dashboard from scratch. So what I want to see is salesperson. I want to see amount sales and percentage gross profit. That's what I want to see. Now how do I want to see this information? Well, reporting data analysis is a discovery process. Usually when a manager is thinking about a new analysis, they have an idea where they want to go, but they don't know yet until they get to that point. So if you're using another person, like an IT person to come up with your report, it may take several back and forths between the manager and the IT person until the report looks exactly like the business person wants. So it takes a while and it takes a lot of interactions and sometimes people just don't have the time. They're on the phone call, they need to make a decision and they cannot wait a second. So this tool also has features to help with the journey. So let me show how this works. So because I selected salesperson, amount, sales and gross profit, when I go to this show me button, it has some options. Here, let me explain what the show me button is. This tool was designed by Stanford University professors. They analyzed how business people analyze data based on kind of data. You select what kind of data. Data visualization techniques are helpful, helping people to See trends to figure out information or get insights out of it. So this show me button actually has that functionality built in. And as you can tell, I have a bunch of options highlighted because they are relevant to what I selected. And I have a bunch of options not highlighted. Like no mapping capabilities. I have no geography component in in my analysis. I don't have address. I don't have ship to address, so I cannot map them. So it's not available. But I have everything else. So let's see how the tool helps me find a good visualization technique to show salesperson sales and gross profit. Let's just click and choose. So let's go for the first one. So the first one shows me salespeople, amount sales and gross profit. Nice. You know, it's a grid. If I like to see numbers by the pennies, I love this approach. But in my case, I like charts. So let's see what else we have here. Let's go from the second one. Oh, look at that. So this one we have boxes. The size of the box relates to the amount of sales. Bigger boxes, bigger sales. In the color of the box represents profitability on this color schema. Kind of cool, but yeah, you don't like it, click next one. Now another representation. Bigger box, bigger sales. Color schema still representing this kind of more visual. I kind of, you know, it's a little better, but you know, you keep on clicking until you find something you like. In my particular example, I love this one, I have my salespeople. I have amount sales bars for amount sales and I have profitability on another bar set of bars. Now in my business, I have these two salespeople that they are rock stars. I don't need to manage them. They have large accounts. There are different departments. Let me get them out of the picture. So I select one of them and I click exclude. I select the other one and I click exclude. So take those guys out of the way. Now I can easily sort this list by descending or ascending. And now we also have a bunch of new salespeople that I also don't care about. They are still in the beginning. I don't need to worry about them. I'm going to exclude them as well. And now we have everyone else. Let me remove these two guys as well. So now I have everyone else. These are my top sales among the remaining salespeople. Kind of liking this approach. I think we're going a good direction, but I'm a very visual person. I like colors. I like the colors, the shape to really give Me a quick insight so I don't have to think much about it. And I want to see this by profitability now in these bars here. Well, let me drag profitability into my color mark. Actually let me choose all of them. And I'm going to drag profitability into my color mark. And look at that. Wow. Now this is. I have a much easier insight just by the colors I can see. My top salesperson has a, you know, profitability is more reddish than green. This guy is really red, really bad. So probably we have to check what's going on. Anyway, I love this view. I think it's right on. I'm going to wrap it up. I'm going to call sales and gross profit by wrap. Awesome query. Happy. Let's wrap it. Okay, first one. Let's go for the next one. The most exciting one in my perspective. It's a geography analysis. So I want to see let's say ship to or let's use sales customer address. And by the way, customer address. I have currently configured to be country, state, city and zip information. I can have any geography component analysis. Can be county, it can be address, it can be territory, whatever the territory arrangement is. So as long as there is a geography component, we can build geography analysis. So I'm going to choose customer address and I'm going to see sales. Those are the two parameters. Again, I want to discover how to see this information. So I go to my show me button again, you know, and see what options and I could start, you know, clicking around but I want to know, I want to see a map. So I go straight to my map capabilities here. Let me try start with this one first. So I have a map and I have sales in two countries and I have the color schema, but I want to see by state. So I have my country level. Right now I'm going to click to expand and now I see sales by state. Okay, kind of cool. But it's very hard to tell how much more sales I have between the states. Looking at the color schema, I actually now have a hard time figuring that out. Let's see if the other mapping capabilities is a little more informative. Oh, look at that. Now we have bubbles. Bigger bubbles, bigger sales. Now I think this is the direction I'm clicking the size mark and increasing the size of my bubbles. Oh, look at that. Awesome. Very informative. Now I can clearly tell the size of the sales by the size of the bubble. I kind of like it. But you know, when I'm analyzing, I want to see, I Want to slice and dice these sales by some other components in my sample database. I, I have this deal size which categorizes my invoices by small, medium and large size. And suppose that in my business, those metrics, the size of the deal is something critical that I'm always looking for, trying to improve my larger deals or whatever they are. So I'm going to take this deal size reporting parameter. I'm going to drag into my color mark, drag and drop. And I want to say that I want to see my marks as a pie chart. Oh, look at that. That's my Ferrari. So now I have bigger bubbles for bigger sales and I have the color of the slices representing the aggregation of all invoices for each of those sizes. Very nice. Very, very informative. Now, is this growing, Is it declining over the years, over the quarters, over the months, the fiscal periods, the weeks, Rolling months, rolling quarters, whatever it is, time is usually a critical component when you're analyzing your data. So let's take a look how we can spin this geography analysis. Looking at a time component. I'm going to take now the document date, which is my invoice date in my example. I, I can also drag into my different places here like in my columns. So look at that. For every year now I have a different column and I can see the trend going over the years and I can see California is growing and large sales is growing a lot. That's so exciting. It's working. Now remember, I'm building this dashboard which is going to have both queries and maybe my salespeople are going to be accessing it through mobile devices. Now with that in mind, this sounds too cluttered. Too much information to a small screen. So not there yet. Don't like it. Let me try to change it. Let me put my year in my rows instead. So now for every row I have a different year. Kind of cool, same idea, but it's still too cluttered. I think it's not going to work for my mobile device users. Let me drag my year to my pages approach and let me add here some notes to tell what I'm looking at. So I'm going to insert the page name, which in my case is the actual year that I'm looking at. So right now I added the year to my page. So this is 2012 information. And now I have this slider that I can just move to the left and to the right and see what's happening with my sales. And if I'm within the board meeting and I want to show this on a loop playback, I can click here and press play sit backs and let people's jaws drop. This is a real Ferrari. I love it. It changes the year and I see the trend going on. Very informative, very flashy. That's what I want to show to my users. I love it. Let's wrap it. So this is going to be my sales by state. Awesome. I built two queries, I could build more. But for my example, I want to wrap these queries into a single dashboard and publish them to the website. Do it. So I click new dashboard here and here on the left. I would have all the queries. I can have several queries, 2, 3, 4, 10, whatever. I come here and I just drag and drop. Let me drag my sales by state. Drag and drop. There it is. Beautiful. I'm going to take the sales in GP by rep drag. I can put in different quadrants on the left quadrant, top, right, bottom, whatever you want, just drag and drop very easily. Beautiful. Let me give some more room to my map because I love the map and the last thing I'm going to tell is each query is a filter to the whole dashboard. So I'm going to change that very quickly. They are filtered to each other and that's my dashboard. Oh, by the way, let me make this dashboard to fit the screen size. So if it's smaller screen, it's going to be smaller. If it's bigger, it's going to be bigger automatically. It's going to fit the screen size of your consumer devices. I just built a dashboard from scratch. I'm going to rename it and I'm going to call this Johnny Dashboard. There you go. I'm so proud. You know, I built this dashboard. It took me a few minutes. It's very informative. And now I want to collaborate, I want to send to other people all by myself. So I come to the server, I choose publish workbook and then I have to log in with my credentials. And then at this point you select who can see your dashboard. Who's going to be the board members, the finance team, the sales team. You just pick the team and now the tool automatically save this dashboard to that group of people. In my case, I only want to publish my Johnny Dashboard, not the fidic queries. So I'm going to publish it now. I send it to my web server. It could be local or it could be in the cloud. It gives me a little preview, looks good. Now I can go to my web browser and I can even call. Let's Say, my VP of Sales is on the east coast and he was looking for this dashboard. So it took me like five, ten minutes to build it. I called Mr. VP of Sales, please refresh your dashboard on your iPad. He's in front of the client, he does it, and I say, hey, check out the Johnny dashboard. And then he clicks on his iPad and then the dashboard fits his iPad screen and he looks at this. Oh, very cool. I see the sales in 2012, I see the sales size, I see my gross profit and everything else profitability by salesperson. But hey, I actually want to see only sales for my west coast. So if I'm using my mouse or my fingers in my iPad, I select whatever states that I want, I click on them, and the tool automatically filters to show everything else. Who are the salespeople selling and how the profitability is. If I come here and I select only one salesperson, the tool would automatically change and now change how much is this guy selling by state and the size of the deals. Very intuitive, very dynamic, very easy to collaborate. And again, if you want to make notes here and write something that you figured out and send to someone, you save it. And when another person comes to see this dashboard, they will see the notes as appropriate. Easy to collaborate, easy to access information again anywhere, anytime. So another thing is also, if you click on this information here, you can also actually download the actual data. So if I click here now, I want to see the underlying data and this can be also exported to Excel. These are like all the invoice line items that were actually summarized behind the scenes to come up with that particular information. So it's not only to see big picture summarized reports, but you can go down to the nitty gritty data to see details also. And finally, if I'm the VP of sales and I'm actually a sophisticated user, but I'm a busy user, so I ask my assistant to build this dashboard. In a few minutes I get a dashboard. And now actually I want to see something else. I can click the edit button on the web or also on mobile devices. And what I get is on my web user interface or mobile device, I have a similar interface to my desktop client. And now I can start slicing and dicing and I can change this report significantly. Suppose I want to see numbers here. So now I see numbers. And actually I want to see, you know, product line sold. I can come here and this is just incredible. You just drag and drop and you're seeing information. So by salesperson, I see the product line being sold so if I'm a sophisticated user, I can also have ad hoc capabilities, even using a web device or a mobile device. Very powerful. So that was my product presentation. I hope you like our Ferrari as we call. I'm going to go back to my PowerPoint to wrap up the presentation. Pricing is usually a big question that people ask us. How much does it cost? Well, we like to talk about the ROI first because that's really what this is about. Yes, reporting has a cost, but at the end of the day, what really matters is if your decision makers can make more and better decisions. Can they move the needle? Can they improve their bottom line? Can they sell more? Yes or no? If the answer is no, then yes. You have to look at the cost. If the answer is yes, can they have an idea of by how much? In our experience, people that have used BI and they have extended data self BI for their sales force, they have seen sales increase of 1 to 5% just because the more sophisticated salespeople, not all of them, but you know, the more sophisticated ones, the ones that use data as a tool to make better deals, to close more deals, because those guys can actually sell more, can sell faster, can sell better, and they move the needle by 1 to 5%. Now how much more business is that on a yearly basis? If you sell more than $10 million per year, we're talking about six figure extra business to your organization. Now we should talk about bi, how much does it cost comparing to that benefit? And you should ask those questions to your organization first. How much more productivity? How much more sales? How much better can your company get if you have a tool like the slpi? Make a figure on a yearly basis and now look at the cost. Our solution turnkey is pretty much a five figure investment. Usually in the low five figure, $15,000 is typically what you're going to be investing from licenses and services to get what you saw for five users. So if you increase your sales by your productivity by 1%, is this worth it? That's a question that you have to answer. But that's how we position ourselves. We have a lot of business value for a cost that is not inexpensive. But looking from an ROI context, we usually deliver a lot more than we charge for. Alrighty. So by the way, you are all muted because we have too many people. But now I'm going to open for a Q and A and I would ask you to actually ask questions using the GoToMeeting panel on the right. So if you can expand the GoToMeeting panel on your right and you can ask questions. We will address them. If we don't have time to answer all the questions, we're going to email later and contact each one of you individually to go over your questions and your comments. So please feel free to make questions. And there we go. We got some questions. So the first question is what is the typical time to deploy DataSoft? Bi. Very good question. Thank you. So the actual amount of effort that it takes to deploy out a solution is usually measured in hours or days. Usually in the course of a couple of weeks, maybe two, three weeks, we get it installed. About half of our clients, they take our out of the box solution and they are happy with it. So literally it takes hours to install it in solution. The other half of our clients, they have more elaborate requirements, they need customizations on the system so it may take longer. So overall deployment, it can be done in hours or days worth of effort and usually in a couple of weeks or three weeks time until we get access to your server. We install it, we test it, you test it and we train users. Usually takes a couple of weeks to get that thing covered. Other question. Training. So training is usually we budget a few hours of training on average, four hours to six hours of training is sufficient to get people self sufficient building reports and dashboards in a very good manner. We have some users that actually have learned the tool without formal training. We have self running videos that teach a lot of the techniques so you can actually learn at your own pace. So training overall is usually measured in hours. Good question. Next question here. What about Sage ACPACK version compatibility? Very good question, thank you. About that. So we have worked with ACPAC and Sage Pro, both of them since the year 2000, 13 years ago. And we have built templates that actually facilitate our work to let's say if you're on SagePro today and you are moving to Sage 300, when that happens, most of the time you're gonna keep your history in Sage Pro, you know, gonna start from scratch from a history standpoint in say in adpac. Yes, you're gonna have the customer list moved over, the GL maybe moved over, the product moved over. All those master lists are going to be moved over. But history, usually they're part of Sage Pro. So in the data warehouse actually let me go back here to our architecture. What we do is we take the SagePro history, we bring to the data warehouse and then we take APAC history and we merge them together. We're going to see customer list, product lists, IDs, sales, everything combined in a single, let's say sales history table. Now when you're analyzing your ACPAC sales issue, for instance, you can go for all history, ACPAC and Sage Pro, because now they have been consolidating the data warehouse. That applies to sales, it applies to financials, it applies to, you name it, purchasing, inventory, whatever else that you want to look at. So we have been working with both packages and in the past we, we have people that moved from ACPAC to SagePro. Now pretty much everyone is going the opposite direction. So we have very good experience getting people combining those systems from a reporting standpoint and getting the system together. By the way, before I answer the next question, something that I want to show you that is kind of exciting. And I almost forget here we have this whole Ferrari that I've been telling here and there. Why do we have a Ferrari? Well, as I mentioned earlier, in this market, in the Sage market, all the other BI players, pretty much they are the bimmers, the Mercedes, the Porsches, great solutions, great pricing. But if you're looking for the faster, for the easier to use, for the better, to collaborate for, for the most powerful, the faster, the sexier. We are like a Ferrari in this market. And because we have this Ferrari comparison, we have a Ferrari promotion. If you buy our solution with some minimum license requirements, we're giving a 13 day rental of a Ferrari for the guy who wrote the check or whoever is authorized. And actually the guy who first drove a Ferrari on us was back at Summit. Sage Summit. Is this the guy? He actually had Sage Pro. He still is using Sage Pro, but he's Moving to sage 300 by the end of the year. And he purchased it as FBI during Summit. So he had the first Ferrari drive for free on us. So let me run the video here. That's a pretty nice F430. So this guy was the first lucky guy, Sage 300, that drove a Ferrari for a whole day for free on us. Took his wife to Sage Summit. He was very excited. He has kids, two kids, boys in their early 20s. They were crazy that their dad was driving such a fancy car. All right, let's see. Sorry. Let's get some more questions here. You open the panel. Where is the panel? There it is. Okay, the other question is about how do we compare with Sage Intelligence Reporting bundle in Sage Intelligence Enterprise. So Sage Intelligence, Sage, every time that they come up with a different BI solution, they're getting better. That's really good news. Both Sage Intelligence Reporting and Sage Intelligence Enterprise, they are actually the best BI solutions that Sage has been incorporated over the years and they're doing a very good job refining them, making them more out of the box, bring more value for the Sage products. However, let me show here how we position ourselves with these guys. What they use is they have pretty much acquired smaller companies or done OEMs with smaller companies that provide this enhanced BI functionality. So we qualify them as the entry level 80%. They're probably in the top of this entry level 80%. They provide, you know, it's fairly easy to use, it has a decent performance, collaboration is almost decent. But again, if you look in otableau or qlikview, these two guys, and if you go to researchers out there, like from Gardner or, or idc, companies that do comprehensive analysis of technologies, they have rated Qlikview and Tableau as the best data visualization technologies out there today. The best vendors, as I mentioned, even the market has rewarded them also. They just went ipo, both of them. Tableau went IPO in May and it was the most successful technology IPO for the past couple of years. QlikView went IPO in 2011, if I'm not mistaken. Also one of the most successful IPOs back then. They're growing a lot. Tableau, which is what we have in our OEM, they have over 10,000 customers, they are growing almost doubling business year over year. They over $100 million a year in business right now. And we're pretty much leveraging Tableau as being our sexiest, nicest, easiest to use solution. And if you compare this user friendliness, the collaboration they provide, the performance that we provide using Tableau as well as SQL Servant behind the scenes, you'll be able to see that we are way more refined, we are nicer, easy to use than Sage Intelligence, Enterprise and Reporting Solution. Again, they are great solutions. If you don't have the budget, check them out first. But if you have the budget, and again, if you are looking to get the biggest improvement from a business standpoint, we are the Ferrari. We have a very compelling, very easy to use, very fast reporting solutions that we believe would be important for you guys to take the best advantage out of it. Good question. More questions. So let's see here. The Donut Challenge. We have some people that have been here around with us. What happened with the Donut Challenge? So for those of you who don't know the Donut Challenge until last year, the way that we were communicating how easy to use our solution was, was with the Donut Challenge, if we were doing live presentations, we would bring donut donuts to the session. And when it came to build a report from scratch, we would give donuts to people and make the challenge. So we'd say, I'm going to build a report from scratch and you're going to eat your donut. Let's see who finishes first. So when I say go, you start and I start my report. Let's see who finishes first. So we were using the donut challenge in the past as a funny way to communicate the user friendliness of our solution. Throughout three, four years that we did that, nobody beat the donut challenge. Even though we had some scary moment at one point, one guy was trying to shove the donut down his throat and he choked. So it's kind of a little scary. And then we have to tell people every time, hey, you know, please eat your donut at your own pace. We don't want to call 911 here. So the donut challenge was a very funny way again to convey the user friendliness. Now, we thought that the Ferrari is much more sophisticated approach. It incorporates a lot more than just user friendliness. It talks about speed, flashiness, sexiness, in a way. And then I ask people, do you want a donut or do you want a Ferrari? So that's why we think the Ferrari right now is the way to convey that we are the top 20% of the market BI vendor. With the donut, we don't have that extra edge of being the more sophisticated. It was just a funny way to tell the message. Very good question. So we have two more minutes. Just going to take one more question and then we'll answer other questions by email or directly to each one of you guys. So one guy here seems to be fairly bi savvy. He's asking why we chose Tableau versus QlikView. So we're running the same spot here. These two vendors, Tableau and Qlikview, they are really the king of the hill when it comes to data visualization techniques. If I make a long story short, why Tableau for us is a better fit, it falls into two buckets. First of all, pricing. Tableau has a better pricing model than qlikview. For large clients, they're about the same pricing. But for entry level, Tableau was a better fit for the SMB market. So that was a big plus. But most importantly, Tableau is easier to use, is more wizard driven, while qlikview is more script driven, more like a little bit more technical. Qlikview has more customizing capabilities because you can script it, but you have to be a programmer. So if I make a high level comparison. Tableau is like an iOS, like an iPhone. It's very easy to use, it's designed for everyone. While Qlikview is like an Android phone. Yes, if you're tacky, you can make it sync for you, but you have to be tacky. So from a usability standpoint, Table Blue is like an iOS, easier to use, designed for the masses, really intuitive. While Qlikview you can customize more if you have the right technical capabilities. So we just closed one hour. Thank you very much. Let me put the last slide with my contact information. If you guys want to have questions, if you want to follow up, discuss more details, please give me a call. This is actually my cell phone. I'll be glad to take calls. You can send me an email or use my Twitter handle to communicate with us. Thank you very much. It was a great pleasure. We have recorded the session and then we're going to be posting our website and contact you guys, telling you where to access this recorded. And the next week or so we're going to be contacting you directly to see your thoughts and take it from there. Thank you very much guys. It was a great pleasure. Have a great day.










