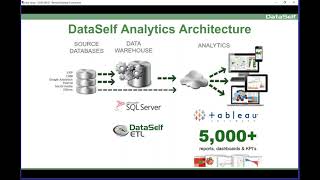
DataSelf AI walks through financial dashboards that pull data from ERP, CRM, and payroll into a data warehouse, then feed Tableau for self-service analysis. The platform ships with over 5,000 reports and dashboards, handling multi-company accounting and currency conversion automatically.
Questions this video answers
More than 5,000 reports, dashboards, KPIs.
About 1,000 financial reports/dashboards/KPIs.
Chapters
And we have created actually hundreds of dashboards looking at these financial analytics KPIs. This is just an example where we're comparing operating income versus gross profit. So in this case, the gross profit is the blue bar. The operating income is the other bars with either orange for negative numbers and blue for positive numbers. So you see the amounts here and the percentage at the bottom of your operating income growth and all information also on a tablet format in the actual operating income report at the bottom. So we have hundreds of these dashboards out of the box already using all of these different KPIs that I'm showing you here. Sometimes people say, hey, actually I want to see how my wages are versus other of your main KPIs. Well, you don't need to build from scratch. It's ready to plug and play. Once you map your wages intel, what the range of the agile account numbers come from, reports like this will pop right off the bat, showing your KPIs. All right, okay, so I covered what I want from a presentation standpoint. Let me go back here and just talk a little bit about how all of these things come together. So what we do is we pull data from your data sources, your ERP system, your CRM system, Google Analytics, payroll, whatever your data sources are, we can pull into the data self data warehouse in A lot of the magic or the heavy lifting of easy analytics is done in the data warehouse. You know, if you have multi company, multi currency, if you have complex, you know, rules to define how you want to see your metrics, usually the data warehouse is where we do the heavy lifting and then we plug the tableau server to the. Can you hear me? Looks like I'm having problems with my sound. Can you please use the chat box to tell me if you can hear my voice? Well, Can you hear my voice? Well, if you can please chat me. Someone told me a message that they cannot hear me. Okay, I'm assuming. Okay, it's back. Thank you for your patience. So once we plug the tableau server to the data warehouse and we bring that information into table tableau extracts, then it's when users regardless of how much training, not regardless of how much training they have, but users will be able to easily access their reports and dashboards. They will be easy be able to slice and dice the data, create new reports and dashboards from scratch, or receive alerts out of the box. We have more than 5,000 reports, dashboards, KPIs. On the financial side, we have about 1,000. So if you want to learn more about from it, please contact me and I'll be glad to talk more details.