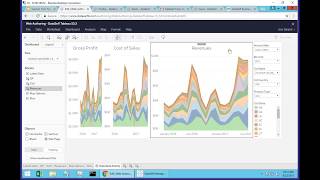
Tableau v10.3 added two web-authoring features: Distribute Evenly, which automatically resizes and spaces dashboard objects, and Stories on the web, letting you create and navigate stories in the browser. Both save time when building dashboards.
Chapters
This is very popular as well. How many times you are building a dashboard and you get something like this, you have different sections of the dashboard that they're not evenly distributed and you want to get them right. So you start to know to put them visually. And if you are very picky, and I'm very picky, sometimes you spend quite a while just trying to get all of these things pretty well evenly distributed. So Tableau created a new feature that allows you to evenly distribute different objects within a container. If you don't know what a container in Tableau is, I recommend you to come to this links here that have a lot of explanation about how containers work. Anyhow, in containers, what you pretty much do is you select one of the objects within a container, you click the arrow pointing down and then choose select the whole container. So in this case, this whole container has these three different objects. Could have as many objects as you want. And when you go here, now click the arrow and choose Distribute Evenly. What it does is it automatically puts the same size for each object, so they are evenly distributed. This is useful for objects like no charts, grids and whatnot, but also for, let's say, filters. Sometimes also with filters, you know, it's a pain to resize them and you get the wrong size. And you can spend quite a little bit of time trying to get all of these things properly distributed. The same thing here. You choose the container and then you click Distribute Evenly and the tool will automatically split the size of all of the objects properly. So if you do a lot of dashboards, learning how to work with containers and take advantage of the new Distribute Evenly feature will save you a lot of time. The last main feature for web authoring that I think is really good for many of you. If you're using Stories now, Stories is also available on the web browser. You can create new stories. Before you couldn't. So now you just come here. There's this new button for Stories. You know, this is new sheet, new dashboard, new story. So click this button to create a new story. I'm going to call, I don't know, first step of my story. I'm going to add one of these queries. So double click one of the queries. And then let me make this just a little smaller. And let's add a second step. So one more step, we're going to put this particular query here. This would be cost of sales. And I'm just going to create another one and put the map. So I just created Story. I'm going to call this story. My new story in Stories are like in PowerPoint. As you're browsing them, you can come here and just use this to go from page to page. You can change the layout to show numbers instead. You might have several steps to tell your story. And in 10.3 there's also the dots approach. Dots was not available in 10.2, so pretty much makes the whole view more streamlined with less real state being used by the navigation capabilities. So creating Stories is a new functionality that was not available on the web and now it's also available on the web. So these are the main new features for web authoring. Again, we will be sharing later a recording of this webinar as well as this PowerPoint, and these links can give you more information about some of the functionality covered on each of these slides.