Drilling Up on Continuous Axes - - - DataSelf / Tableau 10.3

28 Aug 2017 · 1 min
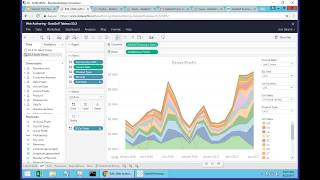
1:02

This YouTube product-demo (created by DataSelf AI and uploaded Aug 28, 2017) demonstrates two Tableau 10.3 UI enhancements: a new "drill up" capability on continuous date axes (allowing users to move from monthly → quarter → year) and a new "Map options" control that exposes map UI controls for viewers.

Questions this video answers

August 28, 2017.

Tableau 10.3.

Chapters

More from DataSelf

youtu.be

Missed Shipments – Two-Minute Demo

11mo ago
youtu.be

Inventory Planning and Projection – Two-Minute Demo

11mo ago
youtu.be

DataSelf for e-Commerce – Two-Minute Video

11mo ago
youtu.be

Store Loyalty & Placement – Two-Minute Demo

11mo ago
youtu.be

DataSelf Overview – Two-Minute Video

11mo ago
youtu.be

Financials – Two-Minute Demo

11mo ago
youtu.be

Historical Data Loss – Two-Minute Video

11mo ago
youtu.be

DataSelf for Distribution – Two-Minute Video

11mo ago
youtu.be

Top Items to Top Customers – Two-Minute Demo

11mo ago
youtu.be

Google Analytics – Two-Minute Demo

11mo ago
youtu.be

Purchase Orders – Two-Minute Demo

11mo ago
See all content









