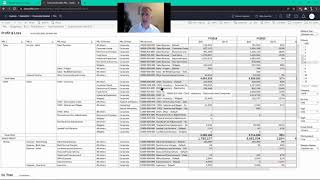
DataSelf Advanced Analytics is a web-based financial reporting system with P&L, balance sheet, and budget dashboards. Click any number to drill down to GL transactions, compare year-over-year, and spot variances instantly. Setup takes 15 to 30 minutes to connect your ERP.
Questions this video answers
Typically a 15–30 minute procedure.
Web browser, Android and iOS apps; can be embedded inside other applications (ERP/CRM).
ETL Plus.
Manual refresh or scheduled automatic refresh (examples: overnight and at noon).
Click the "free trial" / order option shown in the interface to begin.
Chapters
This video is the part two of our financial package for advanced analytics. We cover P and L balance sheet, trial balance and budgeting as well as dashboards out of the financials as well as operational data. So first of all let me just show the look and feel. It's all web based. You can have these reports and dashboards on a web browser on mobile devices, in Android and iOS apps. You can also embed them inside of your own applications such as your ERP in CRM system. So it's very flexible how securely you get your data. And when you look at the reports and dashboards, just going through a quick overview, they look like financials in a web browser. On the dashboard sides we have a lot more that we bring to the table on the rest of the data self analytics. But today I'm focusing only on the financial side of it. So there's also some eye candies with charts and colors and analysis to look at the high level visual perspectives. Now very importantly is this is not only playing P and L and balance sheet reports that you can run and that's it. This brings power. So you can actually slice and dice your data and find out about threats and opportunities quickly. And that's usually what's all about, more informed decisions is being aware of the exceptions, the great and the horrible things going in your business. And you should know it today, not days, weeks or months from now. And this brings this power to you. I'm going to show some examples. I'm going to take the P and L and I'm going to show how you can slice and dice in a few different ways to find out different trends. First, a simple way is to just change in periods. So right now I'm looking at the P and l for periods 1 and 2 in the total. What if I want to see in a different period? I want to see, let's say in the second quarter, I select the periods for the second quarter. Press apply. Now the P and L is for the second quarter. What if I want to compare the second quarter versus the prior years? That's also simple. You just select prior years, press apply. And now you see the second quarter across different years. Is it growing or declining? Very common question. You're seeing how well you're doing versus the prior. Which sections are growing, which sections are declining and why? Good point. So in this example, maybe it's easier to see the data at the year level collapse. I don't want to see the pivots per se. So I'm going to collapse the year and get the periods out of the way. I'm still only seeing behind the scenes for every year, only those three quarters and I see the totals. Ah, interesting. But again, am I growing or declining? Typically we have to export Excel, do calculations here. You don't have to. You can use the measure names which out of the box. We already have a bunch of popular measures pre configured, but you or someone in your organization can customize to add more. And once you have anything that you want here, you just pick and choose. So if you want to see the variance percentage, I press apply. And now in a few clicks I was able to see across my second quarter, year over year, which of my P L accounts are growing and which ones are declining. That's usually part of the journey. Okay, I found something that is causing my gross profit to go down. But then you might want to expand and drill down and go into more details. You can apply filters, you know which segment is causing those discrepancies. Segment two, segment three, you can have multiple segments that can be filtering this or you can even expand and this is one of the things that many times you don't have this easy expansion into your reports. I can click to expand my first column and by default now I break down my report by segment two. So my P and L now is broken down by segment 2. If I expand the segment 2, I go into the segment 3, you can go into more segments in case you have and at the end of the process, eventually you get into your chart of accounts and that's usually where people start to go, oh yes, this particular account, something happened. I'm glad that I saw it so I can take an action to act on that particular opportunity or threat. But sometimes when you're looking at P and L, you're still looking at the month level. Why is this account so big or so small? You might not remember? You need to see the actual details. Typically going to the details means wait for someone to get those details. Here, let me just go back to a simpler look. Let me show how powerful this can get to find the details. Let's say I want to see more details about this particular data point in my P and L. Just a data point. I click on it and automatically at the bottom I have a new section. Show me the GL transaction details with all the journal entries, the dates, the comments, the values in a way that it adds up everything over here and being able to do this everything on the same page. You still see the P and L, you still see the data point may be a problem opportunity and at the bottom you see the why this is happening and this is powerful. You know I chose one account here, one segment one. If I choose a whole section it will bring at the bottom the whole section that you're clicking is driven by the data point you selected and then you have everything at the bottom. This kind of power is unparalleled and we're super excited to help small mid sized companies again make more from decisions so you can be more efficient. The next part I'm going to show how to deploy how quickly and easily you can deploy data self advanced analytics. First of all you can contact us or your data sale var to learn more about these options and the pricing whatnot. Pricing wise you can go over here to see the pricing options and you can just order from right here. Click for the free trial and get the system ordered once it's ordered. Depending if your source system is a source, ERP is a cloud or on premises, there's different directions. Overall what we will do or someone will do is eventually get ETL plus, which is what I'm showing right now. The tool we use to extract your data. To build the single version of the truth from your data silos, someone will have to connect ETL plus to your source system. So we need user credentials, wizards or system and connect to it. Once you do it, it's usually a 1530 minute procedure to connect your source system. Primarily you can go and tell refresh the data or you can schedule it to refresh automatically overnight and let's say at noon. So when decision makers go and look at their reports and dashboards on mobile devices, the data has been automatically refreshed. Deployment of advanced analytics is usually fairly straightforward. Of course you might want customizations and whatnot, but the out of the box package is simple to deploy. The last comment I want to make is the reports and dashboard that I was showing you here. They can also be accessed through emails. You can automatically email reports on a schedule to different users or you can set up alerts to notify people only when certain criteria was met. So again enabling management in small and mid sized companies make more informed decisions in a timely fashion. I hope you have found this video informative. Please feel free to contact your data self reseller or us directly to learn more. Thanks for watching. Have a great day.