Getting Started with DataSelf Analytics - Web users
This is a spoken training transcript explaining how end users interact with Tableau Server 8.0. It covers logging in (including AD vs. local auth), navigating the portal (Projects, Workbooks, Views), searching and filtering content, user preferences and email subscriptions, interacting with dashboards (filters, drilldown, underlying data, custom views, favorites), web authoring (in-browser editing and its limitations), and options for exporting, sharing, and downloading workbooks. The session aims to prepare users to find, view, customize, and share published Tableau reports.
Chapters
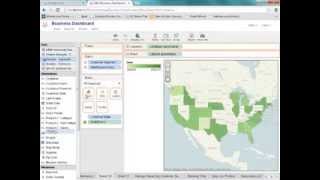
This Tableau Server end user training will discuss how an interactor will login and navigate the Tableau Server portal, as well as interact with dashboards and share results with others in your organization. We'll also discuss some of the new features in Tableau Server 8.0. When you first navigate to the URL of the Tableau server, most often you'll be prompted with a login screen for a username and password. This could be your Windows login depending on whether your organization is authenticating with Active Directory. It might also be a username and password that has been provided by a Tableau Server administrator. I'm now just going to log in. You may or may not be prompted with which site you want to use. Really depends on if your organization is leveraging the multi tenancy feature of Tableau Server to partition your sites into different departments. For example, now that we have entered the Tableau Server portal, we can navigate it through this left hand side. Our Projects At a very high level is a folder within Tableau Server. You can publish workbooks into a project and allow others to then access the projects. Each project might have different permissions on them with different people being able to access and have different permissions on the project level. Your workbooks are what are published from Tableau Desktop. This includes all of the dashboards and sheets that you've decided to publish up that are contained in a single workbook and the views are very simply all of the dashboards and sheets that have been published to the Tableau Server. We can very easily filter content, so if I wanted to filter based on the demos that I have given, I can type in the word demo and it's going to filter down the dashboards and reports that I have published. We could also search based on the project or publisher as well as when a dashboard has been published based on a date. So a lot of ability to find the content that you're looking for by filtering on this left hand side of the view. I'm going to go up to the top right here. So if you are having multiple sites on your server and you are a member of multiple sites, you can easily navigate between different sites very quickly and easily without having to log out and log back into the Tableau server. You also have the ability to easily find any favorite dashboards that you have saved. So we can easily save a dashboard as a favorite. So it can be very easily able to be found on the Tableau server. Now going to look a little deeper into the user preferences. So now that I'm in User preferences. There's a few things that I can cover here, one of which is changing your email address. So the reason for that is we now have a subscription feature within Tableau Server which allows end users to select a dashboard that they want to be emailed to them on a schedule that was set up by the Tableau server administrator. So this is great. If every Monday morning you wanted to open up your email and see a static image of that report, that will hyperlink out to the Tableau server portal that you can then navigate with the live data and interact and filter that information. So you can set up that email to work with subscriptions. You can change the start page of the Tableau server, so this could be at the project level or specific workbooks that you want to have as your start page. You also can set the locale of the Tableau server for your login. So depending on where you're located, you might choose to change this. You can also change the password that has been set up if you are set up with the local authentication with the username and password. So a few different options there. I'm just going to go into flight, for example, back to the Tableau Server by clicking this logo here. You can customize this with your own company logo if you choose. But here I have my different views. I'm going to once again search my content and then interact with a dashboard that I've created. So here's just an 8.0 demo dashboard. I'm just going to connect to it. Now that I have connected to the dashboard, I can now interact with the information that's on this report. I can use my filter so I can make selections and the view is going to update as well as I can then drill down into a mark. If I've set up Tableau Server actions to easily drill down further into information very quickly and easily. Now that I've interacted with the data, there's a few things that I can do. If I wanted to drill down further into California, I might have permissions to view the underlying data and so I can see the underlying data that represents that mark. To very easily navigate at a row level individual transactions. In this case on the Tableau server, I also can choose this remember my changes. So if I wanted to once again filter to California and I wanted that to be the view that others can then share and see that insight that I have navigated to and drill down to that information, there's a few things that I can do, one of which is to remember my changes. So I could call this my California view. I can then remember that change. So now when I log into the Tableau server, you can now see that there's a California view on the URL to navigate specifically to this drill down view of the data. So if I want to manage my custom views, I can choose to share it with others that have permission. So I'll go ahead and remember that a few other things that I can do I might have permission to download the workbook. So depending on whether the publisher of the workbook has provided me with that permission, if I have Tableau desktop, I can download it and do some additional analysis. Here is where you can set the subscriptions. So if I have my email address, I can choose to send this report on a certain schedule to my inbox. Maybe it's every weekday morning or Monday morning. I can set the schedule if I'm a Tableau server administrator. That will then look similar to this type of email where I have a static image of the dashboard report and I can easily click it to navigate within the portal back to the live view to interact with that data very quickly and easily. Now that I have this, there's a few things that I can do with it. We have the ability to add comments, so adding a comment is very simple. If I drill down in some information, I could say look at California again and save that as a comment. So when other people login to this view, they can see the comments that I've left as far as seeing which views they've interacted and found some information or insight into that data. So that's how the subscriptions will work. This is set up by the Tableau server administrator. They will need to set up with the SMTP server, but that will allow those users to set up subscriptions to be able to be emailed these reports on some type of scheduled basis. Another thing that's new to Tableau Server is the web authoring component. So you might have this edit option up in this left hand corner here. Once I have clicked edit, I can now do some web authoring. So if I wanted to modify this view and break it down, for example by region, I can simply drag and drop to place region on the view to further break up this information. Or maybe I create a new sheet and look at some other data differently. So maybe I want to look at my sales so I can double click that and place that in the view as well as maybe I want to look at my customer state. I can easily drag that onto the view, look at it as a Bar chart use show me to make it maybe a map. So it will work very similar to Tableau Desktop, but it's not meant to replace Tableau Desktop. There are some limitations. You don't have the ability to create new hierarchies or new calculated fields. New parameters is very simply to allow users to edit and make some changes by simply dragging dropping different fields to create new worksheets, you can add in new filters. So if I wanted to filter based on region, I can add that region field to the filter shelf. It's going to dynamically create the quick filter. I can make changes to how I want the quick filter to be laid out. So maybe I want it to be a single value list and choose include or exclude. But now I can easily filter down that information very quickly and easily. If you have publishing rights, you should be able to use Save as to save this new sheet to the workbook on the Tableau server as well as you can save or alter any of the other sheets that you were editing. So there are some changes you can add in totals and make some changes there. So web authoring is a new functionality that will allow more interactivity for Tableau server interactors that have that permission and then they will have the ability to slice and dice the data in different ways that may not have been on the initial publish on Tableau Server. I'm just going to go back and I'll click done here and I won't save my changes. We'll go back into this dashboard here. A few things that we can do that you might be familiar with is you have the ability to, for example, export an image or PDF of the dashboard. If I select a sheet, copy the data, or the cross tab of the information, export it to Excel. So there's a few options there to export information. If I have made some selections and filtered down the data, we have the ability to revert all changes which will go back to the original undrilled down state of the dashboard. So I can choose revert all. If I know that I'm going to be making a lot of selections on the dashboard, I might choose to pause automatic updates. So if I want to make five or six different changes to filters or make certain selections, I can pause automatic updates and resume when I'm ready for Tableau to send the query and render those results back visually. I also have the ability to refresh the data for this view. So if I've logged in and I want to see the most recent updated data, I can click the refresh button, which will send a new query back to the data source and render those results back visually. We can see here there's a little star up the top. That means that I have saved this as a favorite dashboard. So anytime that you are interacting with a dashboard and you want to save it, you can save it there. We also have the share button, which allows you to take either the URL. So maybe you're sending an email to somebody to have them log into the Tableau server and interact with the dashboard. You might choose to send the URL in an email or you might be embedding the Tableau Server views into a website. I'm going to go ahead and hit the tableau logo here to go back to that view. We also have the data sources. These are the data sources that are published up from the data server functionality. Tableau Server and here we can create a new workbook. A few new things is we now have the ability to scroll to resize the names for the data, connections and workbooks. So in the past it might be chopped off. Now we have the ability to easily see that information. I can even scroll create a new workbook on the tableau server using web authoring. Once again, Web authoring wasn't meant to completely replace Tableau Desktop, but it does allow for that simple drag and drop functionality within Tableau Server. So. So this training has discussed how to log in and navigate the portal, as well as interact with dashboards and use the filters and Tableau Server actions that might have been published up in the workbook. It has discussed using subscriptions and web authoring, which are some of the new features of Tableau Server 8.0, as well as some of the other ways to find content on the Tableau server. So now you should be fully prepared to be able to log in and interact with the reports that you have published to Tableau Server.










