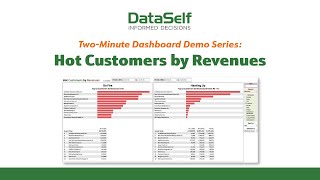
A short (two-minute) demo by DataSelf AI showing the "Hot Customers by Revenues" dashboard. The video demonstrates how the dashboard identifies top customers by absolute sales and by sales growth between periods, explains controls for metric, dimension (customers, regions, reps, items) and filters, and points to a complementary "Cold Customers by Sales" dashboard.
Chapters
Who Are our Hottest Customers? It's one of the most frequently asked questions among businesses today, and one that's not as simple to answer as it seems. How do you define hot the highest revenue producers this month, quarter or year? Or how about those clients whose sales have increased the most from last month, last quarter, or last year? With Data Sales Reports and Dashboards there's no limit to the ways that you can analyze your data, whether sales payables P and L or otherwise. And among Data Cell's 8,000 reports and dashboards is the current one hot customers buy Sales this dashboard does double duty when it comes to sales analysis. It provides both your top selling customers as well as those clients whose sales have increased the most from a previous period, with those time ranges shown at the top of this window. If you look over to the right side of this dashboard, you'll see other options that you can use to control your analysis. For example, selecting what you want to measure, such as sales revenue, which is the default, or perhaps gross profit or even quantity sold. Below that, and of particular interest, are the options for your selected dimension. By default, this dashboard retrieves the hottest customers. However, you can just as easily use this dashboard to retrieve your hottest regions, sales reps or items. And of course, you can restrict what data will be included in this analysis, specific items, sales reps, or any other criteria you'd like to add. By default, the left side of this dashboard retrieves your 12 hottest clients, here defined as having the greatest sales in a selected period. But the right side of this dashboard is even more interesting as it provides your 12 hottest clients in terms of sales growth. In this case, clients who have had the greatest increase in sales from one period to the next. If this kind of information would be useful to your organization, don't forget to check out the matching dashboard called Cold Customers by Sales. With these two analytical tools at hand, you always know what's working and what's not, and where your attention is needed the most.