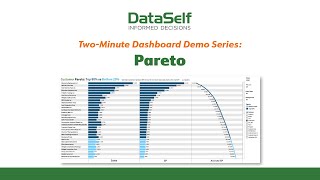
A short demo video (Pareto – Top 80% vs Bottom 20%) explaining and demonstrating a Pareto dashboard that compares top vs bottom performers across metrics (e.g., sales revenue vs gross profit). The narrator shows how the dashboard highlights mismatches — high sales but low profitability or low-sales-high-profit customers — and surfaces anomalies like reps offering large discounts or items with low margins. Example customers mentioned: Gross profitability by customer microchip performs well; Sacramento Supply and Chengdu Water show abnormally low gross profits for their sales level; Nap Associates generated $894,000 in revenues this year with nearly half as profit. The dashboard is interactive (can switch to salesperson or item views) and intended to turn business questions into actionable insights.
Questions this video answers
$894,000
Sacramento Supply; Chengdu Water
The 80/20 rule (attributed to an Italian math scholar)
Chapters
The Pareto dashboard, named after an Italian math scholar who came up with the 8020 rule, starts by showing how your top performers, customers, sales reps, items, etc. Are doing based on a specific measurement. For example, how much sales revenue your best customers have generated. And then this dashboard shows how those same top performers are doing based on a different measure, such as how much gross profit they've generated. For example, you might be happy with your top customers by sales, but you might not realize that some of them have low profitability rates. And you might have some customers who don't generate a lot of sales revenue but are exceptionally profitable and probably deserve more of your attention. This analysis reveals hidden aspects of your business. Do you have sales reps offering unusually high discounts to some of their clients? Do some of your most popular items have abnormally low profit margins? Anomalies like these jump out at you from this dashboard. Consider the current example. Gross profitability by customer microchip is certainly generating both high revenues and high profits. However, there are two customers a little further down, Sacramento Supply and Chengdu Water who are, for their sales numbers, generating abnormally low gross profits. Is that because of discounts, products ordered, or something else? This dashboard helps you find out. Even the bottom 20% of this dashboard yields insight. Nap Associates may have generated only $894,000 in revenues this year, but a little under half of that was pure profit. That's a client with potential, one with further exploration. And this 8020 analysis doesn't begin and end with customer analytics. Instead of wondering whether some sales reps are excessively discounting or whether a few products have unacceptably low gross profits, we can, with a click of our mouse, change our view, perhaps to be salesperson focused or even item focused. Whatever your needs, this dashboard turns your questions into answers.