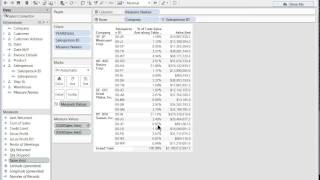
A short DataSelf Analytics tutorial demonstrating how to build a report that shows totals and percentages of totals. The speaker adds a sales amount measure, enables column grand totals, then converts the measure to a percentage using the "Quick Table Calculation → Percent of Total" option. They demonstrate duplicating the measure to show both raw amounts and percentages side-by-side for verification, and show how to change the table-calculation computing direction ("compute using" from down/top to across/rows) so the percent is calculated across the table rather than top-down. Video ends with contact info for DataSelf support.
Chapters
Hello everyone. This is a simple example of showing how to build a report showing totals and percentage of totals. So let me build a simple report here to show the mechanics. I'm going to drop a few parameters in my report and I'm going to add sales amount. So this is total sales amount by two different parameters. Let me put the grand total here, column grand totals. So I can see this is the grand total. Now what I want to actually see is these amounts. I want to see a percentage of the grand total, not the actual sales amount. So I go back to this parameter here which is the sales that is being showed. I click here, I go to quick table calculation and choose percent of total. So now that number becomes a percent of total. If you want to double check if you got the right thing or if you want to make sure you know both the amount and the percent, you can drag again the same measure over. So now I have the amount here and the percent and you can double check if the numbers are consistent. So that's how you can put side by side percentage from a measure percentage of total as well as the numbers. Now what if, let's say, let me put date to my columns here. What if you actually want to make the percentage looking across the table and not from a top down approach? Let's do that as well. So let me go also put here the totals for the rows. So I want to see how much percent this amount versus the total in this amount versus the total. So instead of having the percentage from, you know, top down is going to be across. Well, I can easily convert this sales amount which has a little triangle showing as a table calculation. I can go there and say change the computing using parameter. Instead of being down, it's going to be across and there you go. Now this percentage is how much this is versus the total here. And this relates to this one. And that's how you build amounts and percentage of photo amounts. Thank you very much. If you have more questions, please contact dataselfupport.com thank you.