Power BI or DataSelf Analytics (powered by Tableau): Which is the right fit for you?
Johnny Girardi compares Power BI and DataSelf Analytics for Dynamics users, covering data warehouse architecture, deployment options, and why DataSelf built on Tableau with 5,000+ prebuilt reports. Includes pricing, feature gaps, and a demo.
Chapters
All right, welcome everybody. Thanks for joining today's event. I'm Jason Gumpert from msdynamicsworld.com and we're here for a session looking at the decision between Power BI and Data Self analytics powered by Tableau and what's the right fit for Dynamics users. Our speaker today is Johnny Girardi, Data Self founder and CEO. Good to have him with us today. And during today's session, we do aim to keep it fairly interactive. You can ask questions at any point throughout the event using a Q and A block that you should see to the right of the main presentation area. And we will also have several poll questions to get a better sense of you in the audience and your experiences. So be on the lookout for those throughout today's event. So without any further delay, I'm going to hand things off to Johnny.
Jason, thank you. Can you hear me?
Well, we can.
Perfect. Thank you for the introduction. Good morning, everyone. Thank you for the opportunity to hear our presentation. My name again is Johnny Girardi. I'm the Data Self founder CEO. And as Jason mentioned, there's a lot of talk in the market about Power bi. Is it a good fit when it's a good fit or not? Data Self has been around for 1112 years now and we started with Microsoft World recently. So we thought about this webinar to give some more education how we see bi. You know, we know BI really well. We are a Microsoft BI shop as well. We've been using Microsoft BI framework from the beginning, but we make different decisions in the route of our journey. And I want to talk about why and where we see the solutions being a good fit, Power BI or Tableau. Let me get started here and go to the next slide. So quickly, the agenda. I'll talk a little bit about the BI journey. I think it's important for all of us to know overall where we're getting into bi. When you start doing bi, short term and long term, how things usually evolve. Then we'll talk about why we chose Tableau, why Data Self works in a certain way, give you the explanation of the why of this combination of Tableau and Data Cell. Then I'll spend some time talking specifically about our perception of when Power BI is a good fit, when Tableau is a good fit, when Data Self with Tableau is a good fit. So we'll give you a little bit of perspective and show a little bit of our product with Tableau. When comparing to Power bi, we'll talk about some cost considerations which we believe is very important. When it comes to moving forward with your BI project, as Jason mentioned, we'll have a Q and A at the end and also a few polls. So to get started, Jason, if you could kick off the first poll just answering what BI products you're currently using. If none of them, just don't answer. But if you're using any of these, please check as many products as you've been using.
We'll give you another five seconds or so to finish this one up. All right, so Johnny, there will be a little delay here while we tabulate those responses.
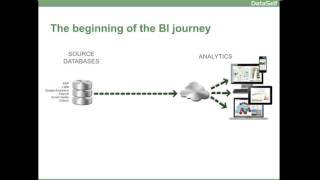
Okay, no problem. And we appreciate the feedback. We find that the polls usually is informative for the audience is informative for us as well. So as we go to our webinars, we always consider the answer from the prior polls to make the next webinars more educational. So we appreciate the feedback. So many people using Power BI and others tableau. Only a few. Okay, very good. Appreciate that. So you can close the poll. Okay, so we've been doing BI. My core team, we've been working together for about 17 years with BI and we have deployed BI solutions, 400 hundreds of mid sized organizations. And over time we learn a pattern. What are the ingredients of a successful BI journey? You know, when you start with bi, it's not for the next six months, for the next two years, it's forever. Once you start with bi, it's going to be for the rest of your business life. So what are the ingredients for a successful BI journey? Well, one of the most important one is decision makers engagement. When decision makers are driving the process, boy, you are into a successful project or at least you're getting the right people asking the right questions and the IT BI people will be following their lead. Quite often the beginning is not necessarily that way. Sometimes it's the IT people that realize they need a better reporting tool because they're getting too many questions and they need to find something better. But again, when the decision makers are actively engaged in the process, leading the process, at least from a requirement standpoint, is when you have great ingredients for the long term successful of your BI journey. The second part is as important is having a BI platform that fits your needs. Now sometimes the BI platform at the beginning can be something simple, inexpensive, that does a job for the next few weeks or few months. But overall you need a BI platform that will support your growth in the long run. The less changes in the BI platform, the more successful. So hopefully you start this BI journey with a platform that will take you from now to months Years, decades, hopefully down the road. So choosing the BI platform, it's quite often a big ingredient as well. And the last one is where quite often there are more trouble, is actually having the expertise, people with expertise to deploy the BI platform and to maintain it. And again, we've done this for hundreds of companies and we've seen all different scenarios. Having the right team to do BI can be challenging. The human component can be challenging. Having the right people, retaining them, being sure that if people change, you can still keep on maintaining without rewriting things. So the expertise, the long term expertise, quite often it's a major ingredient that in many cases cause BI so projects to not be successful or to be successful. So be sure that as you embrace this journey, you have the right people in place to make it successful. At the end of the day, it's all about results for decision makers. You know, they want easy access information anytime, anywhere. They want to be empowered and hopefully they want it to be happy with a tool that it can be more productive, that can deliver the reports and dashboards more quickly and they can find support in a very timely fashion. So quick return to result is usually important for a successful BI journey. Now why I started Data Self is because I saw those three ingredients usually not happening. Mid sized companies, quite often decision makers, they want to drive the process, but the people they hired to actually find the BI platform, they're not BI experts. They got a platform in place, they start working and it doesn't work. Eventually they change the platform, sometimes they change the team. It can be very time consuming, very expensive, very frustrating. We saw that over and over and over. And then we decided, you know, let's start it ourselves and let's be a trusted DI partner that we will show you a best of the breed platform. We're going to be finding out in the market what's the best of the breed out there. Let's make it happen for different mid market ERP and CRM systems. Let's be experts with it and let's make the solution inexpensive, quick to deploy, with a lot of value out of the box. It will be there for you in case you need our assistance. If your team has changed and they no longer know how to support the new team, we can bridge that gap. If you want to rely on us to be your BI partner, we're here. So we decided to be a BI partner that has our own BI solution augmented with third parties with an out of the box that is valuable with all the expertise. So we started Data self back in 2005. And at the beginning of the journey, most companies do something like this. You have a data source, let's say your Dynamics ERP system, and you need better reporting out of it. You need dashboards and analytics for your managers. Quite often what happens, people plug a easy front end. Power BI is an option, Tableau is an option, clickbait, whatnot. They start spinning reports and dashboards. And it works. Yes, absolutely works. Power BI is amazingly cool to get some dashboards out. But what we see is in the course of months, sometimes years, it grows as a convoluted set of reports and dashboards. There's data sources all over the place. Management starts to ask for data from other data sources. You may have a CRM system, you may have Google Analytics, a separate bureau system, a lot of Excel all over Excel files all over the place. And it starts to become very challenging to maintain this analytic solution. Just taking your analytics tool, pulling data directly from the data source, you see poor performance. The source system starts to slow down when you hit it with the analytics solution. Sometimes analytics run reports slowly because they're not optimized for reporting. It's a mess to maintain. And very importantly, when you go this approach, usually you have many people doing these reports and dashboards. They're pulling data from all over the place. And sometimes you start losing what is called a single version of the truth. You go with two reports created by two people that's supposed to have the same metrics, but people created the metrics with different rules and you're comparing apples to pineapples and you don't even know about it. So it's very common to start this journey with a single connection directly from your analytics platform to your data sources. But in the long run usually becomes challenging. So what happens? Well, if you're doing a good BI journey, at some point in your journey, a data warehouse is going to be present. As you become more sophisticated, as your needs grow, data warehouse is a very valuable platform. What happens is the data is copied from all your data sources into a separate database that is optimized for reporting. And then you plug your analytics platform, you still can plug directly sometimes because you want to make connection directly, but the core of the data access goes to the data warehouse. Why? Well, because usually with data warehouse, you will not affect the performance of your source system. You're going to always run fast. The reports will always run much faster as well. So performance on both sides is guaranteed. Data governance with a data warehouse, you put the right people in place to control the data the quality of the data, where it's being pulled from, is it vetted, is it validated so you can know the data is reliable? And third, in the data warehouse you can create what is called a single version of the truth. Just to give an example, if you build in the data warehouse your definition of profitability, let's say gross profit, you can create that definition in a single place in the data warehouse. Now, all reports and dashboards can pull gross profit from that single definition and all of them will show the single version of the truth. So data warehouse has this big benefit of having being a single version of the truth. So if you are starting your BI journey, great. I can tell you if you don't have a data warehouse, it's going to be present sometime in your future as your needs evolve. Second question, Jason, if you can please trigger it. It's just yes or no. Do you already have a data warehouse? Are your organization already using maybe one, two, Sometimes you have more than one people call data marts. But overall is a data warehouse to tackle your BI and reporting needs. Jason, thank you. Okay, very good. Many of them already have. All right, let's move forward. One of the questions that I get quite often is on the BI deployment pros and cons to go public cloud or not and not means private cloud or on premises. So what are the considerations I give? This can be a later discussion and if you want to discuss any of these topics in more detail, you'll find my contact information at the end of the presentation. But let me give you the high level considerations here for public cloud or not. First of all, check your legal repercussions to put your data in the public cloud. If there's no legal repercussions, then public cloud can be a viable option. The legal topic can be tricky, so usually it's better if you involve the attorney or attorneys of your organization. Do you read the contracts of, you know, I mean, if you have data sharing issues, check with the attorney, check with the private cloud offers and see if that is not a deal breaker. Assuming you're good with the legal side, the next major thing that I like to always talk is where are your major data sources? And by major I mean usually larger databases that are really critical for reporting. And if they are already in the cloud, then absolutely. A BI in the public cloud also makes sense. You're already familiar, you're already comfortable, you're already aware of the kind of the limitations of the cloud and they work for you. If your main data sources are on premises or in public cloud, then typically it's better to have at least the data warehouse closer in the same local network as your major data sources because this data volume can be very intense. The actual analytics platform, you have more options. Sometimes you can have the cloud because the traffic between the two might not be as big. If you have a lot of data traffic between your data warehouse and the analytics platform like Power bi, tableau and whatnot, then we also recommend bring it also to the same local network and make it open to the users. So where the major data sources is usually a major consideration. And you should look closely before you make the decision of where to deploy your bi. The last is, is your BI a mission critical application? Usually at the beginning it might not be, but eventually it becomes a mission critical. And be sure that if you're looking for a public cloud, you can guarantee that you have reliability, you'll be able to upload the data when you need in a timely fashion. And when things go crazy because sometimes they fail, what options you have to try to work around the issues. Usually on premises and private cloud, they have more options to tackle those things. But for some organizations, the public cloud can still be a viable option even for mission critical applications. And it's getting better overall. Now why data Self selected Tableau so to just go back a little bit. So when we started data self in 2005, we were primarily a Microsoft shop. We decided to use SQL Server as our data warehouse. And back then we were using proclarity, which was a very successful BI analytics platform, really successful in the Microsoft role. They were only working with the SQL Server analysis services. So we started building that solution and eventually Microsoft acquired proclarity. We were super excited. Microsoft cut the cost significantly of proclarity. We were even more excited. We'd make it easier, faster for our clients to take advantage of it. But at some point Microsoft decided to kill proclarity. And for us it was, you know, we were sad, you know, proclarity is a great product. And then we started to use other Microsoft replacements to proclarity or alternatives to proclarity. And we didn't get the same kind of, you know, success with our clients as with proclarity. So around 2010 we decided that, you know, hey, you know, we love Microsoft, the back end is amazing, but we need to find a replacement for the front end. Back then, the Microsoft BI front end direction was still unclear and Excel was not our, you know, we thought Excel was not the best for our clients. So we say let's find something else. So we went on a journey to find a replacement for our Excel slash Proclaritis solution. And as a business vision of data self, what we want to do is to find very successful BI components. So SQL Server, very successful for data warehousing front end. We want to find someone that is really successful and then we want to add our own secret sauce to make it easier, faster, more affordable and become an expert around that. So we, we went to the garden magic quadrant around 2010, 2011 and we say let's look at these folks and let's see which ones can fit our needs, the needs of our clients, the budget and whatnot. So we looked at about a dozen of them. We analyzed, we assessed Tableau was still in the middle of the pack. They were not yet one of the leaders. But we decided Tableau at that point because by far, by far it was the easiest to use. And to me as the, you know, the company owner in the visionary BI is for decision makers, for people who are not necessarily IT savvy, they're not necessarily business analysts, they're easier to use the tool the more we're going to be empowering them. So the ease of use was the number one requirement and back then, boy, Tableau by far was the best. So right there they got our excitement. Their architecture was also great. They had desktop applications, they have web based applications, they already had an infrastructure for cloud so we thought they had the right architecture. It's fully compatible with the Microsoft back end, so integrated with office and whatnot. So it was a great fit on the architecture. Their pricing was within the range of mid sized companies so we would not break the bank. So pricing was great and those three components, pretty much they sealed the deal and we embraced Tableau. If you look at Tableau for the past four years in a row, Gartner has rewarded them as the gold standard for analytics is the company that has been doing the best in the four last years at least when it comes to empowering decision makers. And of course Microsoft also is one of the leaders. And this is from a year ago. We're looking forward for the revision 2017. Anyhow, I don't want to say that Gartner tells everything is perfect and whatnot. Tableau, Microsoft, they're not perfect, but definitely out there. They are leaders. They're one of the best BI platforms. Now I personally was intrigued by how and why Tableau was so much more successful empowering decision makers than any other BI player. And this sentence kind of Summarizes quickly of the why most BI vendors when they created BI tools. It's kind of some folks, usually business people or technical people, they hey, look at the other BI solutions. I think I can do something better, something faster, something, something flashier with more options and whatnot. And then they created a new BI product. That's a fairly common way to create a new BI business actually was our way in a way as well. Tableau did not start that way. The founders were actually Stanford University professors and they were studying how decision makers look at business data and have insights from it. So in this study they hired psychologists, graphic designers to study the process. You know, what is the problem, how decision makers look at it, how they make decisions when they get deceived by the data, when they get clarity from the data. And once they finish this study, they realize that hey, actually we can create a software to help decision makers go through this data discovery by using what we learn in this process. Tableau was pretty much the only BI vendor that I know that they started the business from the right angle looking at the real problem of the data insights, business insights and eventually creating a product to fulfill that decision. So it's a great story, very interesting. And that's why they have been so successful in empowering decision makers. They are even anal about we're only supporting visualizations that give beautiful insights. It's not about being fluffy, it's not about distraction. This is a business want to be sure you get the right insight accurately and quickly. If it's anything else, if it's distraction, what not, we don't want to support, we want to make it hard. Or you can throw this visualization into another tool to do things that are distracting. And sometimes I didn't like about their being so analog about it, but over time I really appreciate and I think they're right. I mean we have to focus on Insights effectively now just showing the data self architecture with all the components. So we have the data sources, the data warehouse, the analytics platform. As I mentioned, we're happily using SQL Server as a data warehouse since the beginning. It's an incredible data warehouse platform now in our vision of making BI easier, faster, more successful in the long run. In the beginning of our business we had a decision to make. We know that many businesses don't need a data warehouse at the beginning, but if they don't start with the data warehouse and when they need it, they'll have to rewrite a lot of their bi. So what are we going to do with that? Can we make data warehousing something simple that we can always get from the start inexpensively, and we decided to give it a shot. So we actually created our own ETL extraction, transformation and loading tool that pretty much eliminates SQL programming. There's no need for integration services, there's no need for store procedures. It's much easier to deploy and maintain SQL Server data warehouses with our ETL tool. The goal was even if a client doesn't need a data warehouse yet, let's make a data warehouse framework that is inexpensive, easy to deploy, easy to maintain that it's better to have one now than starting in a few years or in a few months. And then you have to rewrite a lot of your BI solution. So that was one of our secret sauce to make BI easier from the beginning is having a simple data warehouse. From the get going Tableau is the analytics platform we've been using for since about late 2011. And in the course of 12 years deploying this kind of solution for mid sized companies, we have learned from our clients reports that are very valuable for most clients. And we realized that that's a major component of a successful BI journey is having reports that will answer business questions. So over the course of 12 years we have kind of crowdsourced these reports dashboards and today we have more than 5,000 reports dashboards and KPIs as a starting point. So with Data Self, if you start using our solution, you don't have to start your reports all from scratch. A lot of the reports and dashboards you need most likely are ready to go or with little tweaks you can have them adapted to your needs. And that covers AP, AR, GL, inventory purchasing, sales, sales order, CRM opportunities, contact management, tech support and whatnot. So a lot of value as I get going. So some people even tell us, well I can have my data warehouse and I can have Tableau. Why exactly do I need Data Self? So just to make a point, if you don't have Data Self, if you go by yourself, which actually absolutely you can do, what's going to happen most likely is you're going to be building all the pipelines between your data sources and your analytics platform. Being Power BI or let's say Tableau, it's going to take time, it's going to take expertise. Be sure to retain these people because you'll need them as you grow, as you need more things and you're going to get it, you're going to be Building reports 10, 20, 50, 100, perhaps whatever the number is. And you get it done or we can shortcut the time significantly and you will know from the get going what you're going to get usually in a few weeks and how much you're going to cost. So we can give you for like a packaged price or investment. You'll know that you're going to get a lot more as a starting point and then you can start customizing on top of it. So that's in a nutshell, what we add as value. JSON, if you can trigger the poll number three, how many BI experts do you have in house? And BI experts are people who only work with, you know, that work with bi, such as data warehousing, Power BI or BI tools and really know what they're doing with those tools. Jason, if you can close the poll. There you go. So a lot of people with no PI experts and many people with two to five. Okay, much appreciated. So now comes probably the most important part of the presentation where I talk about Power bi, tableau and data self analytics. What about them? What's our take as far as these three options? Just want to be sure, you know, it's our take, it's our opinion. In a way, we are experts in tableau. Absolutely. Power bi, we are not experts. We've been looking every year we take a very serious look to see how our competitors are doing. But because we are BI experts, I believe our opinion has some value as you assess your own options. And we're always here to share our learnings. If you want to have a conversation to discuss options, we'll be honest. We'll tell what we think will tell the good and the bad. And it's your decision to find the right fit. If we are the right fit, we're happy. If we're not, at least we're glad to have you help making that decision. So let's start talking about what we like about Power bi. First of all, it's practically free. Doesn't matter if you get the free version or the $9.99 per user per month. From a business standpoint, I say it's free, it's very inexpensive, it's awesome. You can just get it done even without a budget, pretty much. That's awesome. It's really fast to get the feet wet. You download, you try it, you poke around and quickly you can get some nice visualizations out there. And usually you get excitement from other folks, decision makers or not. So it's easy to get the feet wet really fast and really easy. Microsoft usually does a great job integrating their products very tightly. So sure enough, Microsoft is working hard on this integration and as we look at how their vision is the integration with Dynamics 365 and other products and with Office, it's great. I think for companies who are heavily invested in the Microsoft product, Power bi, it's going to be a very nice integration into the whole package. Even though Power BI is a fairly new product, there's good online resources, the community is active. So as you search through when you hit some issues, quite often you actually find decent questions or answers to how to tackle or at least people trying to help you go over those issues. The last thing is if a BI public cloud solution is a good fit for you, it's a very well designed solution that is available. So if cloud based BI public Cloud based BI is a good fit, well, definitely Power BI is a very solid option. Now, some the Power BI features that are not available in Tableau yet and that's as of two days ago. Both companies, Microsoft and Tableau, they are usually releasing new features Microsoft is doing very frequently. Tableau is a more mature product so it's not as frequently but overall let me talk about the current status. The first thing that you know it's beautiful in demos is the natural language for building queries. If you write sales this year by customer, the tool will build that particular view especially for demos. I love this feature, it's very compelling. I believe natural language for query building has a bright feature as we all in the BI world realize the pros and cons in how to well use it. Some of the things that I'm excited as it will empower more decision makers to become more self sufficient doing their own analysis, which is really the ultimate goal of bi. The challenge is for webi to create structures where business people will not mess things up because quite often they will not know how to ask the question in the right way. They ask for something but the question delivers a query that is different than what they thought they asked and they make a decision based on the wrong information. So the challenge of natural language is to really read the BI people with artificial intelligence and whatnot, being sure that when we answer a question of a decision maker, the question has been really well defined and we're not there yet. So I usually tell people it's a great feature for demos, but in real life it's tricky and you got to be cautious how you give it to end users. But you know, it's amazing. I mean it's promising. Tableau is also about to roll out something like that. But for now, Power BI already has it. The community created custom visualizations. It's an awesome also idea, letting the community define different ways to have visualizations. It's crowdsourcing visualizations. It's, you know, I've seen amazing things, I love it and I think it's successful. One of the potential downsides is, especially because I'm so into the Tableau philosophy, is those visualizations sometimes are very distracting if you want to make decisions quickly, efficiently. Sometimes distractions take conversations away from the actual problem and it's very easy to get out of the topic. So I personally have mixed feelings. I actually like Tableau. It's more controlled, it has less options, but options are really insightful versus having a lot more options and being confused by which one to use and spend time in things that might not be so insightful and more for the flashy side of it. So you have to just be careful how you use the visualizations in a way that is really insightful and not just distracting. The other thing that also Power BI will always do a better job in Tableau is to have native integration. More, I would say more native integration with Microsoft software, like the integration with Cortana and Excel that Power BI has is more tightly integrated. Tableau has a lot of integration with a lot of software products, but Power bi, because of Microsoft, they're always going to be ahead of Tableau in my perspective. So these three features right now to me are quite great, very promising some of them, as long as you use them the right way. And Tableau still does not do some of them. Now what are the limitations? And again, as of two days ago, and again, we are not Power BI experts. So some of these assessments, some of you guys may tell us that we're wrong and I would completely welcome your feedback. The first thing is just it's a very young product. If you've been in the software business for a while, you know, it takes many, many years for a product to become very solid, very robust, very fully functional. It just takes time, run the bugs, find more features. When we adopted Tableau, it was already a 8, 9 years old product, fairly well defined. Right now it's about 13 years old product. It's really well defined. So Power BI is still very young, changes very frequently. So for me that's a problem if you're trying to get a BI to support in the long run because the product is still young and with many things to be improved. Overall, Tableau focuses on answering questions intuitively and it goes back to How Tableau designed their user interface. Back to the Stanford University study, and it's amazing. Let me show an example of how great Tableau can answer questions and make a little analogy to what we know from Power Bi. So now I'm switching to Tableau Desktop, which, which kind of in a way is similar to Power BI in many senses, but I want to show some of the differences. So now I'm playing the role of I'm analyzing my sales and profitability by company. So here in Tableau I just double click sales. I have the total sales, the whole company history. I double click company. It breaks down sales by company, each one for its own bar and then gross profit. I want to see in a color shelf. So I can tell quickly here that this particular company has very low profitability, 9% while the other ones are about 50%. So let's just focus on this particular organization. So let's just see that one. So this one 9%. So far, everything that I've done also in Power BI is about the same ease of use, very straightforward point and click. But here is where Tableau starts to have a few last clicks to get to the insight. And when you're a decision maker who are not a business analyst, every click last that you have to go through, the more likely they'll have the answers at the speed of their thought. And as they think about something, they spin it re spin it and the tool will keep on going. That so far, as I said, it's similar to Power bi. Now what if I want to see this on a trend line? Well, here again I just double click invoice date and I get in a trend line in Power bi. I would have to think, ok, now we need to start a new view and kind of rebuild some of the components to get the same view and know that the first query is going to filter the second query. So there's a lot more thoughts to go into the process to get into this view in Power bi. Can you do it? Absolutely you can, but it takes many more clicks to get to the same point here I just double clicked and I got from that particular view into this perspective which shows trend lines over time. If you want to see on a monthly basis. There's so many different ways you can slice and dice your data from a time analysis. And as you may know, in bi, time analysis is very critical. So Tableau already has a very mature, very refined ways to do all sorts of different time analysis. So in this case I'm just going to show sales on a Monthly basis, then quickly we take a look here, some of the months I have losses and that could be points to make data discovery and find your issues. So overall, Tableau does a great job at More quickly with less clicks intuitively lead you to answers. By the way, the other thing is this show me button in Tableau. It shows all the data visualizations available in Tableau. It's kind of similar in a way to Power bi. But what Tableau does is it disables the views, the visualizations that are not possible with those particular data points that you have. So out of this study from the Stanford University, they created an engine that will help decision makers to walk through the discovery process with less clicks. And that's really critical, being quicker, being faster to get to the results. Another major limitation is, well, if Public Cloud is not a good fit, well, Power BI is not going to work for you, period. At least so far. There's no alternative. And with Tableau, you can have public cloud, private cloud, and on premises. So more options. Maybe you start with public cloud, maybe it's fine, but maybe you realize in one year you got to bring it back. If you're with Power bi, and if Microsoft does not change the direction, you have to scratch the whole project and start all over with another product. So with Tableau, you don't have that risk. You have more options, short term and long term for your BI journey to be successful. You cannot compare multiple categories with Power bi. Let me show what I mean by that. This is a visualization in Tableau where you have categories here, two level categories here and one on the columns. And then you can quickly see that for distribution, in this case for veggies, you know, two of them, you're having low profitability. This kind of visualization is still not possible in Power bi, and we find it is quite useful often. So it's a pity that it's not there yet. Limited filtering, the same as the time analysis. Filtering is a very important thing. Having a lot of ways to filter your data. Tableau has a lot of options for date filters. There's so many buckets that you can look at it, relative dates, range of dates, wizards. Pretty much what I put screenshots here are things that we haven't found yet. An easy way to do in Power Bi, maybe you can, but it takes a lot more clicks. And in Tableau it's usually point and click. You fill out a few forms or a wizard and you can do a lot of filtering and a lot of formatting of how filters look in your dashboard. Let me show an example of filters here. This is a simple dashboard and we have here a few filters. Invoice date you want to see this year, previous year. Very quick and easy. You can change, you can switch to quarters, months, weeks, days. Look at the this, previous, next and last three. This is amazingly useful date tilting capabilities. Just one example. If you want to filter by measures, you have radio buttons, you have checkboxes with include or exclude. You have drop down lists. There's a lot of options and as you need them. It's amazing that Tableau has been around for long and been refining. Think about the needs of decision makers and make the process easy. No dashboard actions yet. What is a dashboard action in Tableau? If you open a dashboard, let's say in Power bi, if you open a dashboard and you want to drill down, typically you can drill down into that particular segment. Let's say I'm looking at Applana. If I click here, I can go into the Atlanta next level or I can drill down across all different segments of the next level. Tableau supports the same thing. Yes it does, but it has more. And the dashboard actions is very valuable. If you click on any of these boxes, it's been configured to not go down, but give you drill down options that can go into completely different, different reports or dashboards. So not only a drill down, but you can drill across. You can drill from a financial report into CRM, into any other thing. So being able to drill into anything else from a beginning point, sometimes it's critical. And Power BI is still not supporting that limited map functions, I think I don't need to talk about that. But there's still many limitations in Power BI and Tableau is really well, it's been working with maps for a long time. It has a lot of options. The desktop does not work on Macs. Sometimes that's critical. Not supported data visualizations are limited to 3,500 data points and sometimes that can be critical. Just a quick example here of what I mean by that. If you go to a query like this where we're plotting on a scattered plot different CRM campaigns and sales by product and customer. Each circle is the sale of a product to a customer. And there are 30,000 data points here. So we can see the whole trend. The outliers in Power bi, this query would have to do a lot of filtering in in order to analyze much smaller data sets before making decisions. So this is a limitation I hope Microsoft addresses quickly because to me it's a deal breaker. If you don't have this, you're not going to be able to do analysis that sometimes you really need. The DAX DAX scripting language for Power BI seems more complex than Tableau scripting language. We're not experts again, but when we look many scripts side by side and how Tableau does things, we believe that Tableau has a much easier to use option for more complex calculations. One major limitation is there is limited data volume upload to the cloud. Pretty much it's 1 million records per hour, the maximum. Hopefully they're going to be increasing this. But you know if you hit this limitation when you're going to hit it when you need it the most that day when the year closes, so the quarter closes and you need to run your reports and something goes crazy goes wrong and you have to reload data and sometimes you know the backup is not enough because you need some kind of other data and boy, good luck. So to me you have to be really careful. If you have a lot of data, 1 million records is little, not a lot. If you have a lot of data, this data volume upload limit can be an issue for the long run success of your project. What do we like about Tableau? First of all, and still by far, we believe ease of use in their philosophy to focus on beautiful, beautiful, insightful visualization that's great, no distractions. So we like that it's a mature solution, it's very comprehensive. There's a lot of features already incorporated and usually every few months they release a lot more. So we're happy with the way the product is evolving. There's an awesome volume of online resources. We've been working with them for about six years now. And usually most of our own tech support questions are answered by just searching Google for the question and you get an answer. Someone already hid this problem, already found a solution, we just got it. It's amazing how valuable 24x7 how you get support through online resources by Tableau per se and also the community. Tableau community is large and is really active putting posts. Their pricing is pretty good and you have deployment options public cloud, private cloud and on premises. Now when is Power BI a good fit? When public cloud works well, when the BI needs can be tackled with the evolving product. There's too many limitations. But hey, if your BI needs don't need those limitations, sure, it's a good fit. Absolutely. When you have time to tackle broader BI needs, maybe BI right now is not ready yet for all your needs. But hopefully by the time you hit those needs, Microsoft has released patches and improvements that will address them. So if you have time, absolutely Power BI is a good fit. And of course if you have no budget or very limited budget, it is, it is great. When is Tableau a good fit? Well, you have flexibility of deployment. You can deploy in the cloud now or you can change later. Back and forth, doesn't matter. Whatever you want to make a change, it will give you the options. So it's good to have options. You never know what's going to happen in the future. It covers a very wide and deep range of BI needs. So pretty much whatever you want to do or you know it's pretty much covered or most of the things are covered. If you need to tackle your broad BI needs more quickly, you want to go more quickly. You cannot wait for them to come up with new features. Tableau by far is way ahead of Power BI when it comes to broad and deep BI features. And if you have a budget, you need to have a budget to invest because it costs more than Power bi. When data self analytics is a good fit. Well, these four points are Tableau's because our client tool is Tableau. But we add more value to Tableau. The need for fast time to results. You know you need to get to results quickly. You need reports right away. You cannot wait months or years. You want to get everything very quickly. So we deliver that out of the box. A lot of reports. Data warehouse plug and play. If you need a solution that can seamlessly grow with your business without breaking the bank. So our solution, from a starting point, we have a data warehouse. As you grow, you don't have to rewrite the data warehouse, you just keep on growing it. If you don't start with a data warehouse, you might have to rewrite your solution. So our solution already has the components for the long term growth without rewriting much of it. If you need a team to support that has expertise in tackling mid sized organizations, BI needs knowing BI tools, knowing your data sources, knowing how to put it together. We've been doing this for a long time and we have a great track record and finally easier visibility or control over your project budget. With us we rarely ask for more money. If we tell it's going to cost you X amount of dollars pretty much we will deliver the scope in that amount in that time frame. So we are experts doing this. We do this day in, day out. So we give you visibility control. What is the profile of a typical data self analytics client? Typically it's not for small companies, so you have to Be at least about 20 million. Yes, we do have smaller clients. Much smaller. Yes, we do. But typically above 20 million per year is a sweeter spot because our cost is no longer an issue. It's more about the value. About 70%. 70% of our clients are distribution manufacturers and our 5,000 reports were mostly designed around them. If you're not in that business, usually it's only a fraction of the reports will work for you. About maybe 500, 1,000, 2,000, depending on what you need. And again, usually we tell people if you need more visibility, control over the time, the fund and expertise to get to the results, we can deliver that. So that's typically the profile of our clients. That's our next poll. Jason, please.
Okay, that should be up.
Thank you. Maybe you close quickly because we only have five more minutes. I'm almost done. But yeah, we'll close that.
And maybe for the sake of time, I'll tell you some of the results here because it'll take a few more seconds. So 12% say doing poorly, 53% say slowly evolving, and then 25% say doing great. Another 12 say non existent.
Okay, very good. Appreciate. And it's pretty typical. All right. Yep, slowly evolving is the most normal situation. Pricing. I'm going to fly through the slides. So first of all, you probably know about pricing of Power BI Tableau is here and I think we're going to be sharing the PowerPoints later so you can take a closer look to understand in details Data Self and Tableau. In Power Bi we all offer subscription pricing data. CellPH and Tableau also offer perpetual pricing and primarily because two ways. Some clients prefer to invest in perpetual license because in the long run they become less expensive. And second, because sometimes clients want to do a capital investment instead of a expense investment and then perpetual makes more sense for them. So with Tabloid Data Self, we have more options to hopefully make the financial investment something less of a concern. Now this slide for me is the most important. If you're embarking a BI journey, I guarantee you if you're doing a good job, it's for the long run. And if it's the long run, this is how pricing will look, let's say in five years. If you look in a five year period, the average license cost per user per month is about this. We're talking about a few dozen dollars per month. Doesn't matter if it's Power BI tableau or data self, it's 10 to, let's say $50 per month. If your employees on average make, let's say, I don't know, five grand per month. It's kind of a low number, but just know, let's say five grand per month, regardless of this is 1% of their cost. Usually the BI should give a lot more value than 1% per month, a lot more value than $50 per month per user. So for me, the price of the license, it's not or should not be the decision making point for your investment in bi. You should look at everything else. The features, the out of the box, the deployment, the services. Those things will define which BI solution to choose. The license cost per se. To me, if there is value, the license cost should not be the main point. And with that I open the final poll and then we'll go for Q and A. And by the way Jason, if you can leave this poll a little open and start checking if there are questions we can address since we are almost running out of time.
Great. Yes, we'll leave that one open and we won't be sharing the results on that one. So the first question was just about the presentation and I think you touched on that. We will find a way to make the presentation here available to everyone who registered for the event today. So if you have any other questions, either about features of Tableau and Dataself or perhaps even Power bi, maybe if you've done your own analysis, we'd be interested to hear that as well.
I'll change my slide to the last one in the meantime that has my contact information. If any of you want to discuss further about Power bi, Tableau, Data Self and other BI solutions, we know many of them. You have my cell phone, my email address. Feel free to contact me. I'm here mostly to educate and if we're a good fit, great. If we're not, I'm glad to share what we have been learning and give our unbiased opinion of what we know. So feel free to contact me at any time.
One question here, Johnny. What would be the main difference that we can address customers with from a sales standpoint so that we could get their attention and I'm guessing asked as a partner.
Yes, that's an awesome question is how to get user traction, I believe. And boy, we've been so many different cases where the decision makers, they say the top decision makers, the BI teams are excited. They push this great BI solution with a lot of users and only a fraction of people use it and a lot of money was invested in licenses and boy it was a waste. It happens a lot. We actually came up with an approach that addresses that from a license cost endpoint that minimizes so you don't have to invest a lot of license until you know who actually will be using the licenses. And so first of all, we have an approach to reduce the cost investment until you know who will actually benefit from actual licenses. Second thing is a tip I can give you to get more user traction is when you start with your journey, BI journey and you start rolling it out. Don't roll out to everyone, necessarily roll out to a few people that you know, they are more interested. They're excited, they want to engage and make available for everyone else. But focus on those folks because they are the ones more likely to make BI successful. They will be successful themselves. And guess what, what are fountain conversations is going to start to go around word of mouth and the other folks will get jealous. Oh, why are you doing that? You're better than me. And they're going to start going after. So instead of you pushing the BI to all the folks, try to do a grassroots movement. Get the ones that are more excited, help them, empower them and let them be the ones to use word of mouth to get more engagement. So that's some quick thoughts before I wrap up my presentation.
Okay, great. And I don't see any other questions, so we will begin to wrap up. If you do want to fill out that last poll question, this would be the time because we will be closing out now. So, Jonny, thank you so much for taking the time to speak with us today.
Jason, it was a great pleasure. Thanks for the opportunity. I really enjoyed it.
Likewise, and thanks to everyone in the audience for your participation and we will be wrapping it up there. I think I see another question coming in. Do you want to leave that for. For answering offline, Johnny? It's related to API interaction.
Yeah, I'm running out of time myself as well, so I'll send offline.
Okay. With that we will wrap things up. Have a great day, everybody.
Thank you guys. Have a great one. Thanks, Jason.










