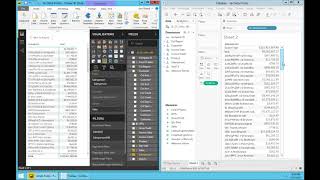
Tableau and Power BI handle large datasets differently. Tableau scrolls and exports full lists smoothly, while Power BI slows down with tens of thousands of rows and caps exports at 30,000 records. A demo shows the difference across datasets ranging from 132 to 279,000 data points.
Questions this video answers
November 8, 2017.
132 data points.
3,384 data points.
279,000 data points.
Exports only the first 30,000 records when the list exceeds 30,000; below 30,000 you get all records.
Chapters
Data point limits for viewing and exporting. What is a data point? In a reporter dashboard, every detailed row of information that you're showing is a data point. For instance, the sales this year of one customer is one data point. The sale of this year for one customer in one product is one data point. But the sales of this year of one customer. But then you show two lines for two different products, those are two data points. So those are data points. And actually there are limits. If you look Tableau, you can, there was no limit. You can create reports and dashboards with as much information that you can put into it. There's no limit. While typically Power BI can only handle efficiently thousands of data points. Is that bad? Will that affect your business or not? It depends. Typically, analytics tools like Power BI and Tableau are not designed specifically to create large reports and dashboards with a lot of data points. Usually the idea is for you to look at the big picture and start to slice and dice or drill down into subset of your data. So always when you're looking at your information, you're looking at relatively small number of data points that you can just look and make decisions out of it. So overall, handling a large number of data points might not be a problem. Now, in real life, at least in my client base, most of our clients, usually they create reports or dashboards, special reports that have a lot of data points, a lot more than thousands. And then when they do that with Tableau, they have no problems. If they are using Power bi, that can create some challenges. I want to show you in real life how that looks. Right now I have side by side in Power BI and Tableau, a report showing very simply sales by salesperson. So both reports side by side, they have the same results. And right now we can scroll on the whole data set, no problem. Currently, the report only has 132 data points. So far, both systems show the information the same way. Now, if I want to add sales by salesperson by customer, here in Tableau, I just bring customer drag and drop. And then this report now has sales by salesperson by customer. And I can drill down, I mean, I can scroll through the whole list without any problem, go all the way to the bottom, no problem. And right now we're looking at about 3,000, or we're looking exactly at 3,384 data points if I do the same thing in Power bi. So I'm going to add now customer to this report. Let me drill down to the customer level. Now this report is showing just like this one the first salesperson, which is null, has a subtotal of 6 million, and something is the same one here. So if I try to scroll down now in power bi and go all the way to the bottom, actually I couldn't hit the bottom. And right now, actually, I have no clue where I am, what salesperson that I'm looking at. Am I still looking at the null or am I looking to something else? So in tableau, I'm sorry, in power bi, the labels are not so straightforward. Like here in tableau, we have salesperson and customer. It's clear to know which column is for what. And as you scroll down, it keeps the salesperson. So I always know where I am. Well, in power bi, I don't. Anyhow, in power bi, if I try to go to the bottom of the list, I just can't in a single scroll. I'm not at the bottom of the list yet. I'm still in the M letter and I have to scroll all the way down until I can go to the Z level. So it's limiting. It's not just drags and browser be at the bottom of the list. You can, you got to just keep on going like this. Eventually, because I only have about a thousand records or data points right now. Eventually I found the bottom of the list, just like here, I found the bottom of the list is the same. So in this case, for about 2,000 data points, it took me, I don't know, a minute, but I managed to get to the bottom of the list. Now what if we add also product? I'm going to add and drag and drop product to my list. All right? So here in tableau, Now I have 279,000 records or data points, and I can just drag all the way to the bottom, no problem, just drag. If I do the same in power bi, I'm going to add product. Now I'm going to drill down to the product level. Now here in power bi, I have the same report as in tableau, side by side. But if you try to scroll to the bottom, good luck. Now it's going to take, I don't know, maybe hours to go to the bottom of the list. Because just this, every time you drag a little bit, you go a few hundred down, a few hundred extra records down, and until you reach, you know, 279,000 records, this is going to take forever. People are not going to do it. This just doesn't work. I'm not 100% sure why this is happening, why, but I think at some point Microsoft will fix this navigation issue. Again, for many organizations, they're not going to be doing all of these data points in the report, so no problem. But for organizations that need to just navigate to the list, Power bi, you won't be able to do it. If you try to export this information, let's say print or export to PDF or to Excel. In Tableau, you just do it. Export the PDF, export Excel, and you get all the information. In Power BI, if the list is up to 30,000 records, yes, you'll get it all. If it goes above 30,000 records, you only get the first 30,000 records. Above that, you get nothing. To me, that's a limitation that for some organizations, will force people to actually do this kind of analysis or reports outside of Power bi, if they have to do that kind of analysis with that number of data points.