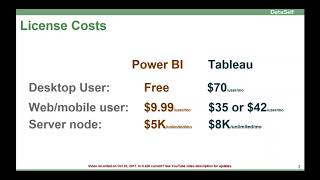
Power BI desktop is free while Tableau costs around $70 per user per month. But software licenses are just the start: surveys show companies spend $2 to $35 in labor costs for every $1 spent on BI software over three years, so total cost of ownership matters far more than the sticker price.
Chapters
License costs desktop user, so it's free for Power BI for tableau is $70 per user per month. The web and mobile user for power BI is 999 per user per month, while Tableau is 35 if you go with the on prem or private cloud, or 42 if you go with their fully hosted user licenses. Both products offer a server node approach which can work with an unlimited number of users, and this is pretty much associated to the horsepower required to meet the needs of your large user base. So it's harder to calculate, but the price is 5,000 versus 8,000. Now it's clear that the desktop and the Web mobile user for Power bi, the license is significantly lower cost than Tableau. Now the total cost of BI might surprise you. There's two recent surveys that cover about 15 different organizations, and the findings are that for every dollar an organization invests in BI software, on average it takes two to $35 in labor over three years to get the job done. The point is, most of the cost of BI is usually in labor after you buy the software and a poorly selected BI software. It's a major culprit of high total cost of ownership. Therefore, do not select your BI software based on the license cost. You have to find which one is the right fit for your needs, because if you have the right fit, you're going to be spending a lot less in labor in the long run. If you have the wrong fit, you're going to be spending a lot more in labor and what really matters is the total cost of ownership. At the end of this video list, you're going to find one of the videos that will dive into more details to look at those two surveys so you can learn a little bit more of other organizations and how that might translate into your own investments. So don't miss that video.