Power BI vs Tableau * OUTDATED VIDEO, SEE BELOW FOR THE LATEST
A 2017 comparison of Power BI and Tableau for midsize companies. Tableau wins on ease of use, deployment flexibility, and mature features. Power BI is cheaper but had limits: 10 GB per user, 3,500 data-point visualizations, and weaker filtering.
Chapters
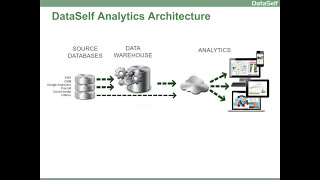
So let's get started. What I'm going to talk is what I believe is one of the most important pieces of the puzzle that many people just forget and they jump straight into the product. Oh, I'm going to use Power BI and let's just make it happen. Well, there is a journey that you're going to go through and I like to be sure you understand the big picture, the long term goals so you can set your mindset the right way from the beginning. So we'll talk about the BI journey, then we'll jump into a more specific perspective into the Power bi. I'm sorry, we're going to be talking about why Data self have chosen tableau, how it's working for us and then we'll dive into specifics of comparing Power BI and tableau High level, some specifics. I'm going to show a little bit of a comparison side by side of both. So you have some insights on that. And as Laurie mentioned at the end we'll address questions and answers. So let's talk about the BI journey. To me this is critical. This is one of the most important things that people should know when start embracing a BI platform is hey, welcome. The BI journey is awesome. Your team is going to love it and it's for the long haul. It is not going to last six months, two years, gonna be for the rest of the organization's life. It's awesome. Now there are three main ingredients that are required to make this journey successful. One of them is what everyone does. Let's find a product to do it. So yes, absolutely, the BI platform you choose is critical for the long term success. No questions. Now the second is the people to pull it together. I've seen many times in organizations in this market where the people selecting the BI platform and putting together they're not BI experts. And sometimes this ingredient is one that makes the project slow frustration. Sometimes they scratch the BI platform, they choose something else. So having expertise to select the right BI platform and to put it together is critical. If you don't have any in house expertise, if you have time to learn it, great. If you don't have much time to learn, I recommend finding consultants, experts, partners that can complement your team so you can find the right BI platform and put it together. The third ingredient, probably the most important is having the decision makers involved in the process. Ultimately they are the ones getting the value from BI and they are the ones who can make an assessment of how much time you have to put it together and how much money you're going to get to put it together. And sometimes the most affordable solution is not the right one. As long as you show the decision makers all the variables, the cost, they will be able to tell you, yes, let's go with this one or with that one. So kind of simple slide, but I've seen so many times people forgetting one of these ingredients and quite often that causes the BI journey to be bumpy. So highly recommend pay attention to these three things. Now, what is a regular BI journey? I see this over and over and over. Well, people have an ERP system like Navision and then they say, hey, I need something better for my reporting. What they usually do, they call the NAV reseller and they ask for a better BI solution. And of course, most likely you're going to get a BI component, it's going to improve the NAVISION reporting. And great. All right, well then you have, let's say another system, CRM system, I don't know, maybe dynamic CRM, maybe Salesforce, whatever. And then you want to need a better BI from it. Quite often you ask the reseller of that platform, can we have a better bi? Or maybe you have as a reseller of the first system and then typically you end up with a second BI exclusively for that package. Now you have two bis from two systems. Guess what, you have more systems, maybe a payroll, maybe Google Analytics. And eventually you get another bi. And sometimes one of these bis could work with all of them, but then there is no expertise. The person who knows ERP doesn't know the Google Analytics or doesn't know the CRM. And then eventually you have this mass of different systems. Calling different consultants to maintain them is expensive. It's hard to maintain when you do this. Sometimes you may realize that you need something better and sometimes you change your whole system because it's not working. So I see this over and over and over. So that's just reality. Many clients. This on the other hand, is a more structured BI journey. Quite often when you start your BI journey, you can connect your, let's say ERP directly with your analytics. Maybe Power bi, maybe Tableau for instance. But at some point in the future, very likely you will need to have a data warehouse between your data sources and your analytics to bring the data together, to blend your data, to massage your data, to clean it. There's so many issues that if you connect directly the analytics to the data source, the data warehouse usually addresses them. So data warehouse is usually something you'll need at some point for consolidation and single version of the Truth. And second, the analytics platform you choose should have a wide and deep range of options, BI options. And quite often when people choose an analytics platform is to address a specific need they have right now, but they don't look six months out, two years out when they have a lot more needs. And this BI and analytics front end is limited. So you have to start gluing different pieces together and spending hours and hours and hours to make this little frank stain to work. So having a data warehouse is usually something important in having an analytics platform that covers a wide and deep range of BI needs is usually critical. Now with that BI journey behind us, let me tell a little bit why I found the data self. I did that in 2005. I was already working with enterprise BI for mid sized companies and I saw those problems that I just covered. People, midsize companies, quite often they are not BI experts. They have a hard time choosing the right BI platform. Sometimes they choose a BI platform, they have a hard time putting it together properly. Sometimes they have a hard time bringing these BI features and needs to fulfill the business people needs. You need to know data technology and business needs to bring them together. And I thought, wow, I think there's a lot of needs in this market that need to be fulfilled. I wanted to have data self that will be the king of the hill. I want to be a BI expert. My team should know a lot about BI BI options and we're going to be focusing on a platform that you know will be really solid and will help clients to move from point A, B all the way to Z in BI needs. So when we have BI expertise and have a solid BI platform. Now the other thing that I saw over and over and over is when people start with their BI journey, they quite often start from scratch. Oh, we got the new BI tool. Awesome. What's we're going to do with it? Well, let's build this dashboard or let's build that other one. And usually in months, sometimes in years, they build 20 reports and dashboards. 30 maybe. It's okay. In these 12 years with dataself, we have seen hundreds of our clients building reports and dashboards. And quite often these reports and dashboards are just generic. They can work for many clients. And we thought, huh, let's bring these templates that our clients are creating into a library of reports and dashboards. So when we deploy our solution to a new client, they don't have start from scratch, they have a lot of reports available out of the box. Hopefully many of the reports they need are ready to go, they don't have to start. So eventually that's what Data Self is experts in. BI With a solid BI platform and a lot of reports out of the box to get you going from a much more developed way, not from a blank sheet. So how is the Data Self architecture looking from the well structured BI platform that I showed? Well, we use SQL Server for data warehousing and out of the box we have a data warehouse that is comprehensive for several ERP systems such as Dynamics, pretty much all Dynamics. We have the data warehouse ready to go and many other competing products. We cover a lot of CRM systems in the market as well. Dynamics, your M Salesforce and whatnot. Now for data warehousing we use our own extraction, transformation and loading tool, meaning this data warehouse can be deployed and maintained in a fairly code free environment. You don't need to know store procedures, you don't need to know integration services. It's very user driven, easier, faster to deploy. Maintain it on the analytics platform. We have chosen Tableau as the analytics platform and we'll talk more about it later. So I'll skip it for now then. In these 12 years deploying this kind of solution to mid sized companies, we have built more than 5,000 reports, dashboards and KPIs. How about that first starting point? A lot of our clients when they start with Data Self, sometimes they go by weeks, months. Some clients, they never build a report from scratch. There's a lot available, they just search, find the right one, sometimes they tweak it and there you go. So it's a great out of the box solution with 5,000 reports, dashboards and KPIs. Now why did we choose Tableau? Why are we using Tableau? Well in a nutshell, to me as the decision maker of Data Self and as a BI expert, the most important requirement of BI tool is being ease of use is for decision makers. Many of them are not it savvy. So the easier the better, the closer to how their brain works the better. So Tableau is being considered by Gartner the gold standard for ease of use for five years in a row. So we're happy to be using Tableau because it's really easy to use. Second architecture, they have very broad and deep range of BI tools you can deploy on premises in the cloud hybrid, many options, whatever the client wants. Usually there's a way to easily tweak to the client's needs and pricing. Yeah, Tableau is not free, it has a cost but by far the benefits of it are still far greater than the cost. So pricing was also a major component. Why we chose Tableau. This is the latest Gartner Magic Quadrant and Microsoft and Tableau are the two leaders, meaning the best BI vendors available out there. Microsoft has a fairly kind of a big set of BI tools that kind of complement each other if you know how to blend them together and glue them together. So both options are great in our perspective. We love Tableau because it's a product with a most of the components already built into a single framework. You don't have to learn so many pieces to put them together. So it's easier, faster to usually tackle a broad and wide, broad, wide and deep range of BI needs. Now why has Tableau being rewarded the gold standard for analytics for the last five years in a row by Korner? Why are they so successful in that front, in that side? I think this story is very beautiful. Most, I mean all BI vendors that I know at least they usually started with some software engineers, data scientists or entrepreneurs looking at the other BI tools and think, hey, I can do better, I can make it faster, I can make it flashier. Pretty much all of them has this thought and that they built this BI tool that became successful. Tableau started from a different, from a different approach completely. Tableau founders, they were Stanford University professors who were studying how decision makers look at data and have insights. It's a journey, it's a process. This study that they went through, they hired psychologists and graphic designers to study the business person's mind and how they look at data and how they make decisions. And at the end of this study, which was a multi year study, they look at this process, they say, wow, we can actually create a software that will help decision makers to go to this journey. And, and then they hired the software engineers to make Tableau. So unlike the other BI vendors, Tableau started from the very real problem how to make how to have insights from your data in how to focus on the insights, not in being fluffy, not in being fast necessarily, but how to help decision makers to walk through the data discovery journey and be more successful. So I think how they were founded and even today they keep on being very focused on this approach. That's why they have been so successful. Now that I kind of covered the foundations and why we chose Tableau, I'm going to go into more details about Power BI tableau and data self analytics. Let's start with the most obvious thing, probably something that most of you already know. Pricing Power bi. You have the pricing here. It's free if you use the basic online services. If you go to The Pro is $10 per user per month and the desktop is free. Tableau. The equivalent is pretty much this. You know, the online is 42, the server is 35 per user per month and the desktop is 70. It's more expensive. Yes, it's more expensive. But to me, and as we're going to be seeing the next slides, the real cost of BI is usually not the licenses but everything else. How easily you can empower people, how much you can empower them, and how much effort is going to take the IT team as well as the decision makers to get value from it. At the end of the day, the license cost is almost like a drop in the bucket. It's important, yes, but quite often the other things are even more important. So what do we like about Power bi? Well, of course licenses are almost free, so that drives a lot of attention. A lot of people always start with the conversation from this perspective, hey, it's free. Can we use it? Of course you can. Is it the right fit? Well, let's talk about it. So being really low cost is a great driving to get people interested. The other thing is it's super fast to get the feet wet. Microsoft says five minutes to wow. I would say it's five hours to wow or five hours wowing. When I started to look more closely at Power bi, it is really impressive how much things you can do very quickly. It's really impressive. I even wrote a post telling that in my personal experience for five hours, it was not exactly five hours, but for hours. I was like, wow, there is so much things I can do. Because I was pretty much following the videos from Power bi, how to do this, how to do that. I was like, wow, this is really impressive. You can be wowed for quite a while. It's great. The online resources, if you need something you you search if it's possible to do what you're looking for, you'll find the answer online. So overall, if the feature you're looking for or if what you're trying to do, it's possible already, it's likely that you're going to find the answer online. So I like the online resources. It's a very active community, very exciting people working with Power BI on the Microsoft side as well as on the channel and users. So it's good, it's cloud based, it's a good thing. You know, if cloud based solution is a right fit for you, you don't have to worry about infrastructure. Whatnot so they have a fairly well designed cloud based approach. So that's also something good. And finally because it's Microsoft, Microsoft is working towards integrating Power BI really well with the whole Microsoft BI stack. So if you are highly invested in Microsoft software components, this can also be a positive feature for your for your BI system. So these are things that we like many, many benefits. Now let's go over the more the Power BI limitations and I'm going to talk about some of them. I'm going to show some of them side by side. And again keep in mind I am not a Power BI expert. With the help of some people that know more Power BI than I, I put together this list. If anyone knows something that I don't know, please let me know. This is as of this morning and sometimes Power BI releases something right after and I'm outdated which is good. They're releasing things fairly quickly. Anyhow, let's go through the perspectives. So the first thing is and we help all sorts of different clients and many clients still don't find a good fit to put their data in a public cloud. So because currently the Power BI offers limited and sometimes impossible on prem in product cloud options that's to us it's a, it's a major downside yet they are improving it. They are about to release some additional options that make more availability for on prem and private cloud. But it's not there yet. And obviously as they release things it's still new, still will be improvement. So if you need BI that is not in the cloud public cloud, Power BI will take a while to mature that part of the puzzle I believe. So limited options for anything that is not public cloud. So if you are going with the public cloud or if the public cloud is an option for you, the next problem is you have limited data volume upload. So if you need to push your data to the cloud, well you cannot push too much too fast. You have a limitation which for some people is okay if they don't have a lot of data but for many people this sometimes can create a lot of extra work and headaches when there are issues. Because the Internet was down we needed to run these reports is it the end of the month and boy you know it's going to take a while to upload new data or more data. So this is one of the issues with cloud in general. If you have a lot of data, pushing to the cloud can be limiting. Also with Power BI you have limited data capacity is 10 gigabytes per user. You have a lot of data. This may end giving a lot of extra work again to work through the different options that Power BI provides. To work around this limitation again, you may be saving the license cost, but you may be spending a lot of time and effort to work around some limitations. If you have little data, this is not going to be an issue because 10 gigabytes is a lot when it comes to analytics with Power bi. No comparison of multiple, multiple categories. That's actually, let me switch gears here. When you're building charts in Power bi, you still cannot do charts horizontally and vertically together. You can only do one or the other. And this is kind of interesting. I mean, pretty much all, I would say mature BI tools, they allow you to put together columns in rows for charts like this one. Power BI still doesn't support that quite often. Like this is a simple example where putting this information in this way is very easy to see different product lines by company, by different market and see which ones are doing well. Yes, you can do the same thing making a long list or making three different segments. But from a BI standpoint, it's interesting why this BI feature is not yet available as part of the native Power bi. That's something that we use quite a lot in our out of the box solution and it's still not supported. Limited filtering. Oh boy. Filtering is such an interesting thing. Power BI actually has quite nice filtering capabilities. I would say the basics are covered and covered really well. When you go to Power BI and you check how filtering can work and how you can change the options, what not, the basics are there. Now as you become more sophisticated with your bi, let's say after a few months of building a complete BI solution, you start running into many requests or requirements that will require different spinning of your filters, twists and how to set it up and how they work across the different databases, what not on the tableau side, Let me see if I get here, I'm just showing here some options of filterings which on the surface look similar to Power bi. But as you go through, let's say this particular date kind of filter which is a kind of built in functionality in tableau, very easy, you just drag and drop and you get this functionality. You can set this filter for different time buckets. And as a user, I don't need to learn how to set it up once it's here, you just, as a user just pick which bucket you want to look at and you want to see this year, previous year or you want to go to quarter months, whatever. Very easy, very intuitive. It covers A lot of different ways to filter by dates. Very simple, very, very useful. And it's amazing how much value people get from this particular kind of filter. Sliders for values is something that Power BI is coming up. I think they're rolling out about now. Was not available yet. Now it's coming up. But even if I look at this one in Tableau, there's a lot of different options already built into the framework. All of these filters with Tableau have been around for several years and what happens? Users will complain I want to do something, I want to do something else. And then Tableau have been around maturing and they have a lot of things covered from a filtering standpoint. When I'm experimenting with Tableau and Power BI and trying to see if I can do Power Bi the same thing as having Tableau, quite often I grow frustrated because filtering is something that Power BI is still the foundation is great. There's a lot of basics, but when it comes to fine tuning, there's still a lot of effort for them to make it really, really broad and deep ways of filtering options, limited map functions. If you have tried to put data on maps on Power Bi, you probably know what I'm talking about. It's quite often is not an easy task. Quite often you cannot do what you want. In Tableau is kind of the opposite. It's usually easy, straightforward. Sometimes I also cannot do certain things in Tableau. It's not a magic wand. But overall mapping in Tableau I have been finding straightforward point and click. While in Power Bi I have struggling and looking a lot of videos and still cannot do many of the basic functionality of maps. So maps is something that also Power BI is still kind of young functionality. No dashboard actions. People also call drill down throughs. Let me show what I mean by that. To me this is a major yet feature that is missing Power BI because it's so valuable for decision makers. In Power Bi you can build a report and you can easily drill down, drill down, drill up, which is normal in bi, being able to drill down and up. But sometimes you want to drill through. What is drill through? Well, in this example I'm looking at a financial dashboard that shows me by different office, some KPIs. And let's say that maybe instead of drilling down into more details, I want to see something related to my Atlanta office. Well, in Tableau when I click on this bar, I have three drill through options or some people call drill down, but it's actually drill through. And these three drill through options, they were actually Built by the software, by the report publisher. Telling, hey, from this you can go to balance details, it's a different report. You can go to monthly details, it's a different report for Atlanta. Or you can go to the opportunities coming from the CRM. They are completely different reports that I can drill through from this one. So let's say if I choose this one, hey, I go to this other report, and here I'm still looking at Lena data, and I can continue to analyze. So the ability to go and drill through different data sets, different databases, whatnot is usually a very important component of bi, and it's still not available in Power bi. Oopsie. All right, sorry. There you go. Data visualizations are limited to 3,500 data points. If you put on a map, if you put on a chart, a lot of Data points, Power BI will be limited to 3,300. That's an interesting limitation that I also don't understand why they haven't yet addressed. Let me show an implication of such a limitation. Let me take this particular dashboard. This dashboard is actually from a real story. None of our clients, they have three different businesses. This is not their data, but it's kind of similar in a way. So they have three different businesses. And investing company acquired these three different businesses that were owned by the guy who started one of those business. He acquired one, he acquired three. So eventually this guy has three businesses, and eventually the investing company acquired them all. And then the investing company came with their BI expertise and they want to see, well, it looks like the financials are about the same, same profitability, whatnot. But let's drill through all the details and see and find the trends. And here, in this particular example, one of the analysis that they did is they put on a scattered plot all their invoices and they put colors to tell from each company. It comes from the invoice. And then here we have gross profit percentage. And this is the sales amount. So sales amount and gross profit percentage. When they plotted this scattered plot, the total was about half a million records. In my sample, I only have 28,000 records. If I were doing this analysis, as the company did using Power bi, I will look at this and I would have no clue that actually Power BI is not showing my 28,000 data points. It just doesn't even show that information. And then, you know, I would sort, I would say, oh, okay, look at this. So I would say, okay, I want to get rid of all of these, you know, these data points on the far left, because they probably they don't matter. So I'm going to put here, hey, I don't want to see this. I want to exclude. By the way, there is 800% on this transaction. This one is 150% and this one is, I don't know, 60%. Okay, let's remove this one, exclude the 800 now. Hey, look at this, a 200 appear now. Okay, let's exclude 200. This 800 now. I mean all these new data points are starting to pop as I keep on excluding. Instead of, you know, just going out to this, the next one, which is, I don't know, about 1% minus 1. I'm going to exclude from the 140 and guess what? Now I have 40 something. There's so many data points between these two and I have to go one at a time and it's kind of frustrating until you exclude them all. And maybe you have to instead of using this visual approach, maybe you have to actually use filters and poke around. And it takes a while to get to a single simple way of looking at this perspective. Now let me just put side by side the same view in tableau. So here the right I had the power bi and here I go to Tableau is the same when you look at overall looks about the same thing. But hey, I don't want to see all of these right things. So I can easily in tableau tell hey, I'm going to mark all of these guys here. I don't want to look at them. I'm going to exclude a few clicks. Oh, look at that. Exclude a lot of them actually let's even exclude a little bit more all the way through zero In a few clicks I got focus on zero percent profitability and up. Okay, good. Interesting. Oh, look at that. Looks like there's some trends. If I put the 3 and I click on the 3p. I can see that, you know, there's some trends where this company here is have all of this higher up data points. Well, while the red and the green don't show. Well, let's take a closer look at this. And I want to take the company and make part of my rows instead. So now in a few clicks I got three separate charts, each one showing for their own company the trend. And I can see clearly that this company has a very different trend right here. And this was actually what the company was seeing that I was telling about. They saw this major different perspective in one of the companies and as they dug to the details, they talked with people, they realized that they were working very differently than the other two and getting a lot of better business from that part of the market. And eventually the company was able to get all of the other two companies to learn those different approaches and they grew a lot more sales and profitability. This is something that in Tableau would take only a few clicks to get to this insight. While Power BI just here is a lot of clicking to get the things out until you get to the right perspective. It takes a lot more clicks to get the same outside or the same insight. But anyhow, I think the main limitation is Power BI only limits to 3,500 data points. Many people have been voted on this feature to be increased this or eliminated, and it's still not clear when they're going to drop that. But to me, as I as data self cannot embrace a solution that has a limitation like this. It just makes no sense to my client base. Overall. Tableau is better at ad hoc analysis. Let me show an example also. I'm going to start from scratch. And this is also another example of one of our clients that they want to analyze their profitability. Once they got Data Self with Tableau, they were able to see the data more easily. And they say, well, now we have bandwidth to really analyze our profitability and why we're not doing so great as we could. So the CEO actually did this. He came to the tableau, he double clicked sales. He got all the sales. Oopsie, he got all the sales, the whole company history. And then he want to see things by customer group because he thought that customer group could be a variable telling their major metrics and KPIs and hey, he want to see profitability in how they're doing from a customer group standpoint. He took customer group, I'm sorry, profitability and added to the color shelf. And right there he could see that this big box profitability was super low while the other three were pretty high in the, you know, around 50%. So he clicked on the big box and said, hey, only want to see this one. Okay, now I only see customer group. Is this changing over time? So he double click invoice date. It showed now sales by year in profitability as the caller and he said, hey, show me this by month. And quickly he could tell that overall profitability is low in some points. He was losing money. In order to do this quick discovery example that I just went through, I only need to know four features in Tableau. It's pretty much you need to know how to double click, how to drag the color how to keep only one out of four in this case and how to go from year to months. Very easy. Only four features and all of them are fairly contextual. If you look on the on the field that you're looking at, the answer to change to the different view is right there. If you try to have the same exercise in Power Bi, you need to know eight different features, just twice as many as in Tableau. So you need to know a lot more things in order to get the job done. It's just a simple example, but overall, when I mentioned that Tableau has been designed with the business person mind, this is an example. It has been designed in a way that a business person doesn't need to learn many things is usually point and click and they get to the next level and they can go deep, deep and deep. Alrighty. So finally, overall, the reason why Data Self is still not adopting Power Bi is because it's still a young product. It takes a while to get a new software to be really functional with a lot of features. And Power BI is still new. I mean, Microsoft is doing a great job improving significantly and fast, but it just takes time. So a lot of these limitations, I'm pretty sure they'll be addressed at some point. But, you know, so being a young solution is probably the main reason why Tableau Power BI is still not there from a Data Self standpoint. And because there's so many limitations, guess what? Yes, you're saving money on the licenses, but all the labor, all the extra tweaks, the turns that you'll have to do to go through in order to get the job done in, all the extra waiting that the business people have to do in order to get their answers will be translating into hidden costs that are way more expensive than the license costs of, you know, Tableau or Power bi. So to me, at the end of the day, it boils down to because it's too young, the hidden costs from labor and waiting, farly out comes the savings you do on the license side. What do we like about Tableau? Well, as I mentioned, ease of use. It's wide, deep and mature platform. It covers a wide range, deep range of BI features, online resources. Also, if you're looking for something you don't know how to do it, you search it and you'll find the answer. Many deployment options, Public cloud, private cloud, on prem. Maybe right now Public cloud works for you, but maybe in two years it doesn't. Well, Tableau will allow you to navigate back to On Prem very easily. And overall their Pricing is also very affordable when you look at the all cost of the total cost of ownership. When Power BI is a good fit. Well, first of all is public cloud works well, that's a potential to be Power BI good fit. And if you have time to tackle broad and deep BI needs, if you have time and you can wait, no problem, no rush, it's okay. Yes, you can wait for Power BI to improve. Definitely they are working hard. Every month they are releasing additional features and you know, the product will eventually become, I would say really, really, you know, mature when it's a blue, a good fit. Well, if you need to empower your decision makers right now, I mean you don't have to wait. They need information anytime, anywhere. They need to be able to slice and dice the reports, drill down creating reports from scratch. Tableau is still by far the best solution out there. We are looking at all many other options and Tableau still continues to be by far the best one in empowering business users. Now at the end of the day to me it's about time if it's critical to get value to their hands. So Tableau is definitely a great fit. Now why or when Data Self would be a good fit to complement, let's say your tableau approach. Well, if you don't want to start from scratch, you know, if you got Tableau and it's okay to start one report at a time, then you find with Tableau, if you want to start with a little bit more, let's say 5,000, then data self can be a great fit. Most importantly, I would say BI expertise. To have a BI platform with Power BI or tableau whatnot, to be really well deployed to cover your needs quickly and efficiently, you need to have BI experts, people who are expert with your data sources, people who are expert with probably data warehousing because you'll need to bring your data together at some point and people who are expert with your front end. If you're choosing to go with tableau, we definitely have the expertise in all of those things and with the out of the box we can provide great, great value. So at the end of the day some people tell me, Johnny, that's too much information. Tell me in a single word, you know, a couple of words. Why should I choose Data Self? At the end of the day it's time. Time to get value, time to get to business users hands, time for UIT to get the solution done. Because time is money. So what we do is we shortcut the time significantly to get value out of it. Out of this investment. And with that I'm going to open for questions and answers.
Okay, thanks Johnny.
Thank you.
We have a few folks left on the line here. I'm going to unmute them. If you want to re mute yourself, you can do that. But you can feel free to ask questions here. You got an expert on the line. You can also type your questions in the question box and I will ask them for you. And we'll give it another minute here and if there's no questions we will wrap this up. But remember, there's the open form out on Navug.com where you can always post questions on any topic like this that you are looking at or that you are using and have questions on a lot of your peers. Jump in and answer questions.
Laurie, if you allow me, one question that I get quite often while people are posting their question that I like to show is if you go to dataself.com there's a page that shows our 5,000 reports and dashboards out of the box. That's a very popular question. Okay, so what exactly is the 5000? So if you go to dataself.com under Solutions and click this 5000 KPIs, you'll get to this other page where we list the pre configured KPIs for CRM as well as for ERP. And if you click to download the full list you get all the details and you can also click these dashboard samples to see how the reports look in dataself. If you are interested in learning more from our solution. Also, let me just put here. I'm here to help you decide what's best for you. And if it's Power BI or another tool, I will tell you, hey, tableau is not for you or too expensive. Why not? I'm here to educate. I'm here to help you. If we're going to do business together, great. But if not, I'm here more to educate than anything else. And so I always give people, hey, send me an email, call me. That's my cell phone. I love talking with people to understand their challenges, to hear how they're doing. Because you never know. Tomorrow maybe I'm going to be in your shoes and I may need help and I'm going to ask someone else. So feel free to contact me. I've been around for a while. I'll be as unbiased as possible can. And if I'm telling you, hey, I don't know much about this tool, but what I know is this. I'll be honest to the best of my capacity.
Thank you, Johnny. Great resource there. I'll give you a moment here to get his contact information. Keeping in mind that Johnny's slide deck here I am going to post along with a recording on navig.com and if you registered for this course, for those of you on the line, you will get a link to that recording.
And.
I think we'll end today's session. Thank you Johnny, so much. We look forward to hearing from you soon.
Laurie, My pleasure. Thank you for the opportunity. And thank you everyone for joining us today.
You bet. Thanks so much. Hope to see you all on another webinar real soon. Bye for now.










