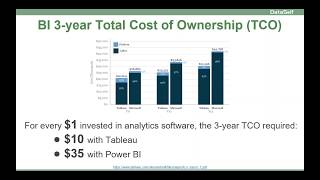
License fees are just 10% of BI platform costs. A Tableau survey of seven large organizations found three-year TCO was $10 per $1 spent on Tableau licenses versus $35 with Power BI. Labor and infrastructure dominate the total bill.
Questions this video answers
August 2017.
Seven large organizations.
$10 three‑year TCO with Tableau and $35 three‑year TCO with Power BI (per $1 invested in analytics software).
29% lower.
Eight clients.
Chapters
Talk about BI total cost of ownership and how a poorly selected BI software is a major culprit of high total cost of ownership. So when people start with bi, they start with baby steps. Typically they have a very small project with very specific needs. For instance, to have better sales analysis or better financial analysis, or maybe CRM information, maybe some Excel files. And they plug analytics platform like Tableau or Power bi. It works great, it's beautiful, and they move forward. Now most organizations as they go through these baby steps, they focus too much on the cost of the analytics software. And that's actually a mistake because in the long run that's a very small cost among the total cost of ownership. Anyhow, they go through the baby steps. Typically, decision makers get super excited. They start to looking at their data in an easy format. They can actually do things that before was very difficult. They get excited and what will happen in the course of years is that your BI platform will grow into something like this. Decision makers are going to start asking you a lot of more questions. They'll require you to integrate a lot of your data silos, probably most of the ERP system, if you have CRM, a lot of Excel files, probably Google Analytics, other systems, payroll, social media data silos. I mean in the course of years this BI will pretty much incorporate most if not all of your data sources and you have some kind of data warehouse framework, data marts and whatnot to bring this data together, to consolidate it. You might have multi company, multi currency to clean it, to make things fast, to make things vetted. So data warehouse will be important component to make this successful, easy and fast. You'll have your analytics platform that sometimes is different from the beginning. If you didn't start really well and most likely most of your data will pass to the data warehouse and some of it will come straight into the analytics platform. This will add a lot of value to your decision making process. And if you want to learn more about it, watch the next video where we'll talk more what it takes to extract maximum value from your BI software. Anyhow, in this current video we'll focus more on the total cost of ownership to really get this done, to really get value from all of your data sources. In two recent surveys, one from Tableau released in August 2017 and one from US more recently, they look at 15 different organizations and how much money they have invested in the course of three years. Tableau survey is from seven large organizations. And what they did, they actually checked the total cost of ownership, which is the vertical axis. Here and how much the BI projects costed using Tableau versus Power BI again in the course of three years. One of the most interesting findings from the survey is that most of the costs associated with these projects were labor. The license cost was a small fraction of the total. Now, of course, being a survey coming from Tableau, I have to assume that for these seven organization large organizations, Tableau was the right fit when it comes to the analytics platform. And if you add up all of these numbers and average them out, for every dollar invested in the analytics software being Tableau or Power BI, the three year TCO required was $10 with Tableau and $35 with Power BI. What does that mean? Well, in the course of three years, even though Tableau is more expensive from a license cost standpoint, but because it was a better fit for these organizations needs, the total cost in 3 years with Tableau was 29% lower than with Power BI. I'm not saying here that that Tableau will always deliver better for everyone. What I'm saying is because Tableau was the right fit for those organizations, the savings in the long run from the labor investment dramatically outpaced the additional cost that they have to pay in licenses costs with Tableau. So the main message of this survey in my perspective is do not select your BIP software based on licenses cost as a major criteria. Instead, look in detail for your specific BI needs, your users, how they're going to be using, are they more tech savvy, less tech savvy, and check which BI solution will be the better fit. Because if you go for the better fit, even if you pay more, you will dramatically increase the odds of making this BI project very successful, that you'll get your decision makers very excited and that your long term cost, especially labor cost, will be dramatically lower. So that's the main message from the first survey. When we learned about the survey and we were so excited about these findings, we thought, what's happening in our client base? We focus on mid sized organizations. In the course of 12 years of business, we have deployed to hundreds of these organizations, analytics and BI software. And we thought, you know, what is their average total cost of ownership? Well, eight of our clients entered our survey and each one of these bars or these lines represent one of these eight clients. And this is a very good representation from our client base because we have one very large client that put a lot of money, three years, also a very small client that put a lot less money in the course of three years and several in between. So this is a nice representation of how mid sized organizations are investing BI in the course of three years and of course using in this case data self to help them out. Also these bars are colored so the blue segment represents how much money they invest specifically in the analytics platform. In our client base this is mostly investment in tableau licenses. The green section represents how much they invested in our own licenses. As you might know, we augment tableau with the data warehousing and and lots of templates to make things easier and faster. And the green segment, sorry the orange segments represent mostly labor investment to get value out of it. Now if you add up all of these numbers and make an average, what you'll find out is that for every dollar they invested in the analytics software in this case again tableau, our clients 3 year TCO required 2 to $5. If you remember from Tableau Licenses survey it was from 10 to 35. So what's happening is our clients are experiencing a 2 to 17 times lower total cost of ownership in three years comparing to traditional approaches using Power BI or tableau. So much lower cost. If you want to learn more how we deliver that, please watch the next video. Thanks for watching.