Power Query / Power BI / DataSelf
Nicole explains why she switched to Power BI for Acumatica. Clark walks through extracting data via ODBC, building Power Query ETL pipelines, and loading into Power Pivot. Johnny covers DataSelf's prebuilt solution with 5,000+ reports and dashboards, typical cloud architecture, and $6k/year pricing for automating reporting that takes over 20 hours monthly.
Chapters
That I want to say thank you to everybody who's joining us today. We decided to do this quick lunch and learn regarding dashboards and analytics and Power bi. And we had several sessions at Meeting in the Minds. Johnny covered his stuff in his session and Clark and I had done a session which we had also had some technical difficulties. So we thought we'd do this just as a quick little follow up to kind of go over some of the different things and different use cases as far as, you know, why people are using dashboarding. You know, just different use cases and what are each experiences, you know, are with using the different tools that are available. For me personally, a lot of people have asked me, are you working with DSD enhancements? Are you creating dashboards for people? Are you designing them? Are you doing custom things? The answer is no. I do not provide any sort of dashboard services or design or anything else. I strictly came into the use of Power BI in particular because internally at DSD we use Acumatica and Power BI connects very easily to Acumatica. I use it to keep track of our internal custom programming and enhancement sales and our maintenance renewals. I use it just out of my own pure need of keeping track of our sales and doing different comparisons year over year. Where are we this year to last year? I particularly found Power BI to be very easy to use. But not to pat myself on the back, I do think that I am a little bit more technically inclined than the average user. It does take a bit of playing around and learning and trying to really analyze the data and look at it and see, you know, okay, do I, you know, once you actually get the data, you know, what do you want that to look like? What do you want it to illustrate for you? I found, you know, I've seen this at least, you know, from doing consulting where, you know, even when someone comes to you with a report, they don't actually know what they really want to see. They just say, I want something that shows me my sales number and there's a lot of back and forth there. It was easy for me to design my own dashboards because I knew what I wanted to see and I was able to technically execute that. I do think that the average user, the average client that we would be working with, they're going to look at dashboards and they're going to want you to come up with something for them and give them a starting place. I think that that's where something like a Power BI or doing things like Power Query and some of the different things that Clark might end up showing those things can be a little bit more difficult because you need some direction from the client and the client doesn't always know what they want. That's just at least my experience with it, I think, especially internally. For me, using Power Bi is a super useful and easy process, but there's nothing prepackaged. They do have some sample files all throughout the Internet that you can download, but that might not exactly match up with the data that you're connecting to, whether it be acumatica or Ch100. So you really kind of have to take your time and play with it and look at different resources that are out there. But it is a bit of a, I would say, learning investment if you're going to go this route as far as doing dashboards. I don't know, Clark, if you would agree with that statement, but that's my thought on Power BI and my experience with working with it. I love it. I think it's immensely powerful with what its capabilities are that are in there. But again, you have to take the time to learn that and be able to try to determine, you know, if you have that skill set and if that's something that you want to take on. Okay, that's pretty much all I was going to talk about. I don't know if you know, you want to cut right into you showing some of your stuff. Clark. We have Clark.
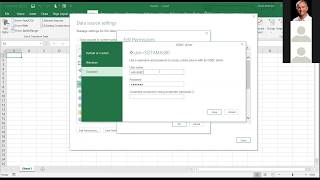
I knew there was a mute button there somewhere. Okay, yes, I can go ahead and move into showing my stuff. So I'm coming at it from a slightly different angle. I am looking at if you as a consultant or a data user want to extract data out of Sage or Acumatica or any other system. You know, what is the benefit of Power of Excel Power Query, Power Pivot or Microsoft Power Bi versus just doing old, you know, the ODBC Microsoft Query stuff. So that's what I'm going to look at now. I'll go ahead and share my screen. I'll share my Excel. Okay, so. So I'm just going to give a five minute demo of how you use this little critter. And there's a special secret in here. Sorry, I'm in a public area, so you might hear other people. I'm using a special secret here that it took me three months to learn this. So when you're getting data from Power Query, there's a slightly different methodology here. And so you click on the, this is on Excel 2016. You click on the Get Data menu in the upper left. And so if you Click on that. Then you can pull data from Excel workbooks, from databases, from websites, or you can pull it from other sources. And one of those sources is odbc. And for those of you that really are like to use your Microsoft query, you can actually pull data from Microsoft query. This is the new way that you actually go ahead and do the old Microsoft query routine. I'm going to pull from the ODBC and this is going to be the special sauce in here. When you're pulling from the ODBC, I'm going to choose just sodamas 90.
And.
It'S going to ask you the first time for a login. You won't find this in any documentation. So and doggone it, it automatically did it after you've logged in the first time. It's all automatic, just like that. But that's not what I wanted. So I am going to force it to go ahead and clear my settings for that one. So I'm going to choose my soda mask 90 and it stores your credentials and the credentials are your user login and then the company code and then your password. So I am going to go ahead and clear these. So it's forcing it to ask for your login credentials. Username wasn't specified. Okay, then I'm going to go ahead and delete them. Okay, that solves that. I did that before the session thinking everything was going to be just fine. So the clue is you're pulling it from an odbc, in this case Sage or from an ODATA connection for Acumatica. When you select your ODBC or dsn it should ask you for a login. There we go. This is how you do your login. On other applications like Logicity, crystal report scheduler, etc. You would use your I have a user login called odbc. Then you use the pipe symbol, the up, the vertical symbol above the left leaning slash above the enter key on PCs. Then you would go ahead and put in your company code. That is how you log in. Otherwise it's going to prompt you multiple times for the SotaMass login and it could be like 8, 10 times. It prompts you and then doesn't come up with anything. It's a real pain in all sorts of places. So then you put in your your password and hit Connect. It comes up with all of your tables. You can select multiple tables by clicking on the checkbox. I want to look up invoice history. So I am just. This is one of the things I like the most about it is that it has the way to look up only the ones you want. I'll check in. Good old invoice, history, detail and header. Okay. It's giving me a preview. Sometimes I go in here just to look at the preview, just so I can see what all the fields are. It can be really handy. You have three options at the bottom, you know, load, edit or cancel. I recommend always hitting the edit button. That brings it into a separate program now called this is the Power Query window. You notice Excel is behind the scenes. This is Power Query. It's a completely separate application built inside of Excel. One of the benefits of this is Excel is limited to 1 million records. Power query is not limited to 1 million records. You can have multiple millions of records in here and then do your filtering and have your final million come back out to Excel. So this is what you, what you can do here. You can go ahead and remove columns, do whatever you want and modify the information. Okay, I'm not going to do any of that right now because that's, that's, you know, that's gets into all the game playing there of that. So I'm going to go ahead and load. I've pulled them into the query now. I want to load two. If you just close and load, it'll put these as two sheets on your Excel workbook. And that really doesn't help you for what you need. So I clicked close and load to and it comes up with another window in a moment asking where do you want this data to go? I only want to want to create a connection. I don't really want it to go anyplace on the worksheets for a table or pivot table. I could if I wanted, but I'm not going to. I'm going to make use of an additional function in Excel 2016 called power pivot. Power Pivot Data model. So I'm saying I'm only creating a connection to the Power query and adding this to the Power Pivot data model function, which takes you into the next step. Power Query is where you can do your etl, your extract, transform, load and control what data is coming in. In a real world environment, I would have deleted all of the fields columns that I did not need in this case for time. I'm just going ahead and doing that now. It shows I've got ABC data, so it's nice and small. 41 detail records, 29 header records. Where did all that go? It went into the Power Pivot data model. This is what pivot tables will use So I click on Manage the data model and another window comes up. These were all developed as separate functions and eventually in Excel 2016, Microsoft brought them all together. Then this is very similar to Microsoft Query. I can go to my diagram view and connect them up. In this case, I'm just going to go do it by invoice. This is one detail with this that you have to get used to. The PowerPivot data model only has. You can only link on one key. So I am going to go ahead and add a column. Where's the add column on this one? This was at the end, going to add a column. And I'm going to say, Clark, by.
The way, I'm not seeing anything besides book two Excel, you don't see any.
Oh, thank you. Let me get back to meeting controls and find out what's going on here. Hang on a moment. I'm going to stop my share and reshare my whole screen. Thank you for bringing that.
There you go. There you go.
Okay, so you did not see all that stuff. Okay. I have three windows. I have my. I have my Power Pivot for Excel. This is called the Data Manager data model. I have my Excel window. And there was a third window called the Power Query window where it looks like this. You pull data into the Power query, you make your rough changes to it. You go ahead and load that to. You load that to the data model. If you load it to the Power Pivot data model, that gives you the ability to add more information. And that's. That's where I was on the last one. The data model has one specific detail that many people find to be bothersome until they get used to it. Okay, come on. Data model changed. Okay. Okay, thank you. The data model, in order to link data in the diagram view, this looks like. Okay, something has happened. Don't you love stuff like this? Okay, come on. Something has happened. This is the demo purgatory. I'm in here. I go to the map data model. It opens it up. Thank you. That's what I'm looking at. Here's the problem in the data model. Power Pivot data model. This is not based on the same SQL principles that we're used to, where you can link invoice number and header sequence number, two tables like in crystal. In Power Pivot, because of their data style, you have to create one field to link them. And so that's why in here, you go ahead, you look at each table and the calculated column. Okay, so I'm going to say invoice history Detail. Okay, I'm going to say invoice history detail and I'm going to say. Okay, Ar invoice history detail and we're going to look at the invoice number. And ar invoice history detail header sequence number. We're going to create our own little compound field. Then it's, it's built in. And I'll call that the key. Then you can go ahead and do the same thing on the other table. Okay, now you can link both tables together. It's at the bottom.
Come on.
Well, that's lovely. What is the other operation in progress? Are we running out of time here?
Yep.
Okie doke. Now this is a perfect segue into what we're about to discuss now is this gets pretty complicated and you've got to do all this and then the next time you want to set up a different query, you do it all again. And then if you do a third query, you do it all again. Each one of these queries in here is individual to that. If you're doing a lot of that, having a predefined data set where all of this back end work is done for you and, and then you just do your pivot tables or all the queries you want, it makes life much easier. And that is where we're going next with Johnny. So Johnny, I'm going to give you the.
I got it.
Yep, you got it. Yep.
Can you see my slide?
We see BI needs.
Perfect. Well, in a. Thanks for the little introduction. Actually I'd like to take the angle of just going back to the basics, which is kind of what you're starting to talk about. And Nicole, I think she also gave some interesting insights. Quite often when companies start to ask better questions about their reporting needs, their BI needs, in my experience in hearing a lot of consultants out there is quite often the people don't know exactly what they want. They want a dashboard or they wanted some dashboards for sales. Oh, good. What exactly do you want and people like? No. Well, they usually have some ideas of what they want. Sometimes the ideas are to automate some of their current reports and dashboards and they want to make something that is automatic, doesn't need to be exported to Excel, going through the loops and hoops to refresh it that is automatically distributed for all salespeople or all the accountants and all the people that need reports. So quite often some of the questions that people tell when they need better reporting is automating what they already know today and eliminate error prone labor intensive processes. And if It's a simple problem, a simple report in dashboard. Taking the route that Nicole and Clark were showing us, it makes sense. You can use these tools, Power Pivot, Excel, Power BI tableau from scratch and build this small number of reports and dashboards. The bigger problem that I usually tell people is actually what people don't know about their business can be more important than what they know. I have this particular client, one client of ours, about two years ago when we started the BI project, the CFO told us they had some major labor issues. Refreshing reports every month for financial consolidation and commission calculation. It was almost about 100 hours per month of people exporting to Excel, manipulating, vetting the data, testing, distributing, fixing, going back and forth. It was very expensive to do financial consolidation and commission reporting. And then the mission was, can you automate it? And we pretty much automated the majority of the mechanical process of doing those things. Prepping the data, consolidating the multi company framework, facilitating the testing of the data, distributed reports, everything automatic, done every day, not only at the end of the month, every day. So at the end of this process, the CFO was like, oh my God, thank hallelujah, it's automatic. I don't have to worry. We can focus more of our time in analyzing the data, not prepping the data. And then he said, well, now that my pain is gone, let me see what Data Self has available out of the box. Well, for 14 years, data self has been building a lot of reports and dashboards from scratch, answering questions that many businesses have. You know, you want to see financials by year, by quarter, by month is a growing decline versus the same year, same period, last year. If you sell something to someone you want to see, you know, sales by customer, by product, by territories, ship to growth, decline, there's a lot of questions that are the same no matter what you do. So when the CFO decided to look at the out of the box, he told me that he found a report that was ready five months before that. He told me, johnny, if I had seen the report on day one, I would have told you, you know what, we can continue to live with our messy, labor intensive reports, consolidation reports for, you know, a few more months. We have bigger fish to fry. He said, we don't know what we don't know, and sometimes we think that what we know is more important than anything else. But the out of the box from Data Self showed me in a single report something that was more important and nobody's paying attention to. So, Johnny, next time that you talk with A prospect that you started a data Self project. Tell the client that phase one is to just deploy the out of the box solutions you guys have. You know, we have more than 5,000 reports and dashboards that plug and play typically in about a day. Yeah, in a day you give us access to your server. Tomorrow we can give you dials of reports covering financials, sales, inventory, purchasing, a lot of different areas. So the guy said, you know, put the decision makers in the driver's seat on day one. Yes, they're going to see that some data is bad that they cannot rely on because there's always some bad data. But if you're running a business, you have a lot of good data and the decision makers will be able to see that. They'll be able to see some trends that perhaps are more important than what they think was important before and let them, the decision makers to tell us, the consultants, the BI people, what the real priorities are. So this story is inspirational. Yes, we, you know, consultants and BI people want to help clients, but sometimes they don't know what they don't know. And having a solution like Data Self with a lot of questions on day one can be super inspirational. So that's a big use case. Start from scratch, usually in days, weeks or months, you're going to build probably a dozen reports and dashboards. It's valid, it's going to cost some money. Or with Data Self, you know, we don't charge a fortune and pretty much next day we can give a much more mature and well developed starting point. I usually tell people, which clients should you be considering Data Self? Well, if you're selling a new erp, if the budget for reporting labor to be part of the Deployment is above $5,000, check with us because we might be more affordable than going through the starting from scratch approach. If the client has data hungry management people asking for reports all the time and complaining that things are slow, complicated, they might be a good fit for themselves. And overall, if the company is spending more than 20 hours per month of someone, some people, internal or external consultants, doesn't matter if they have more than 20 hours per month of people doing labor intensive, repetitive tasks. Talk with us. You know, our pricing is no longer as expensive as it was, it's usually for six grand. That covers the license per year and we can use to deploy the out of the box fairly quickly and inexpensively. From an architecture standpoint, you know, all of these systems we have connectors that deploy out of the box. We bring the data to a cloud data warehouse yes, can also be on premises but cloud is usually easier, faster. We use Tableau and Power BI as the analytics layer and again out of the box. We have thousands of reports and dashboards that are easily customizable ready on day one and that was pretty much my presentation. Our intention from you guys this is primarily a webinar targeted at the 90 mines is to do other webinars where each one of us, Nicole, Clark and I will focus half an hour, a full half an hour in each one of our parts and see if you guys are getting value from it and then we'll keep on taking more dive into specifics as needed. So your feedback if this webinar was valuable, which one you'd like to have more more frequently, let us know and we'll be here to help you be successful with Di as well. Thank you for joining. By the way, we're recording the session and we'll make available as part of the ninetyminds portal so look out for that. Clark, any final question? Comments?
Yes, it actually does work guys. I've done it before and we will be part of my sessions will be going into more detail of how we actually use the this, the Power query functions and power BI functions connecting primarily to Sage 100 in real life practical situations so you can see and try it for yourself.
Alrighty. Thank you all. Thank you Clark for joining and Nicola had to leave early so I hope you guys have a great Tuesday.










