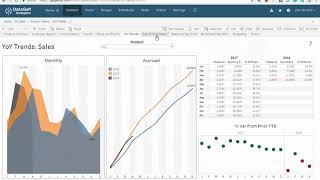
DataSelf AI walks through an interactive sales dashboard that lets you swap metrics between sales, gallons, and gross profit, compare periods side by side with color-coded bars, and drill down to customer invoices. You can also view top customers, seasonal patterns, and call them straight from the app.
Questions this video answers
1.5% decline.
Chapters
Product Trends Dashboard this dashboard provides many ways to analyze product sales trends. The dashboard's main metrics are controlled by this drop down list. So if you don't care about sales amounts, you just select the appropriate measure such as gallons sold or gross profit and the whole dashboard will change to reflect the new metric. Let me go back to sales. The orange bars are for this period sales and the blue bars are for last period. Here are all products sorted by last period sales. Right now I'm looking at this versus prior to date sales and I can easily change the periods right here. Currently this shows a decline of 1.5% on my total year's day sales. Let's say that I'm surprised that this product has a major decline. I click on it to view the customers driving the sales drop and then I click drill down and filter to analyze this product further. So now I'm looking at sales by customer for that particular product. This tab shows invoice details for that particular product and here are the sales by ship to state Bubble sizes is for dispute sales. Colors are for variances. Here are some year over year trends by month and accumulated. I'm still looking at that particular product that I selected at the main page. At any point I can select a different product. This tab shows my top 10 customers, the columns and the products on rows on a descending order. The question here is why some products have so little sales to the top customers. This tab can be critical for businesses that need to keep a close look at seasonal sales. Let's say that I'm surprised by this growth. I'm going to click on it and keep only and then I'm going to drill down to see customer sales and finally sort on a descending order by this year to date sales. Aha. How come these customers are selling these items so much? I'm going to click and I'm going to email or call them right now. And yes, clicking on Call customer from a mobile device will place the call right off the bat. This tab shows budgeting. We have powerful ways to handle and to analyze budgeting. Finally, all data self dashboards are easy to customize. Here's our contact information and thanks for watching.