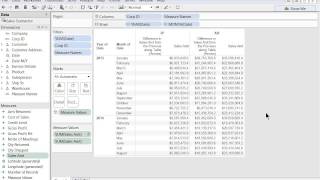
A short tutorial-style video explaining fundamentals of quick table calculations (in a reporting tool). It demonstrates creating month-over-month sales growth (difference from prior period) and a year-to-date cumulative total that resets each year, and emphasizes checking compute direction (across vs down) and validating results by showing the original measure alongside calculations.
Chapters
This video is about fundamentals, about quick table calculations. Quick table calculations are very powerful and easy to use when you're trying to make calculations across columns or across rows in a report. For instance, in this report I have years, I have months, and I have the sales amount for two different corporate IDs. What if I want to see the sales growth from the prior period, let's say take this minus this and see the difference for all these months going down. And what if I also want to see the year to date accumulation, Meaning if you want to aggregate, add sales on top of each other. So at the end of the year I have the total sales reset and start all over. How can I do that? Well, table calculations do that in a very cool and fast way. However, if you don't pay attention to certain fundamentals, you may not get what you expect. So this video talk about those fundamentals. So let's build this report. Let's build one part of a time. The first part will be seeing sales growth from the prior month. So to convert the sales amount that I'm looking at right now into growth from the prior month, I'm going to go to the sales amount here. Click the arrow pointing down and I choose quick table calculation. There are many options, but in this case I want to see the difference between two rows. What I want to see when I select that something happened and I think it's not correct. To help you understand what's going on and to double check that it's correct, we always recommend that you bring back the report, the original measure. In this case we're looking at the sales amount. So let's take sales amount and bring it back, drag and drop into the report. That way we can look at the actual measure and see if the pivot calculation is doing what we're expecting it to do. When you bring the measure back, sometimes it's better to understand putting the measures in columns or rows. So feel free to put them in different place, you know, rows or columns and see which one. It's more easy for you to make sense out of it. My example, I rather put them in rows in columns. I'm sorry. So I have my sales here, the original sales in the table calculation here. So okay, now what is the table calculation doing? Well, good enough. When you put two measures side by side, it tells you the calculation. This example is a difference in sales amount from the previous along table across, meaning is going through the columns. What it's doing is it's taking this amount minus this and putting here. If I was trying to see the growth between the two corporate IDs. That was the right thing. But it's not. I want to see the difference between the rows instead. How can I change that? Well, you go back to your peels here and you see your actual sales. And then the one with the triangle is this difference here. I'm going to click the arrow pointing down. And now we have to check the compute using parameter. So the most popular ones are across and down. And by default in this case it shows across. But I wanted the table calculation to go down the row. So I'm going to click down now. And then if you check the amounts on this column now are. Let's say this one, it takes this one minus this one for this and this. It follows the same rule. So awesome. I just got sales growth from the prior period. Now I also want to see year to date and resetting for every new year. So what I can do is to take my plain sales amount, which is this column here and let's convert into a new quick table calculation. I'm going to click the arrow pointing down. I go to quick table calculation. In this case I'm going to choose year to date total and then it did something. Is this correct? Well, let's go back and add again the sales amount back to my report. And now having the sales amount here, I can see if I add this plus this one is correct. If I take this and add this one, that's what I get. If I go all the way down, it will be all correct. It resets at the beginning of the year and starts all over. So in this case I have my report. I have sales growth from the prior period as well as year to date calculation. If in my report I do not need to see the actual monthly sales, I can just remove out of the report and there it is, the good news. Once you figure you have the right rules, that's all that it takes. You can save the report. And next time that you open the report, you always have the right calculations. I hope you have found the video informative. Thank you.