Sage 100 Data Warehousing & Analytics
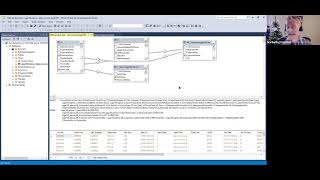
Johnny Girardi explains why Sage 100 users build data warehouses: to handle report complexity, improve performance, and get a single version of truth. DataSelf's solution connects to Excel and Tableau, costs $399 to $1499 monthly, and deploys in 30 minutes to 30 days.
Questions this video answers
Johnny Girardi, founder and CEO of Data Sales.
April 6, 2021.
About 30 minutes.
$399 per month.
Starts at $1499 per month; deployment ~30 days.
Chapters
There you go. Alrighty everyone. Thanks for joining us. My name is Johnny Girardi. I'm Data Sales founder and CEO. Thanks for your time. I'm going to jump right into the session since we have a lot of good things to cover today. The first section of this webinar is going to be covering generic data warehousing and analytic concepts for sage 100. And then the last part of the webinar will talk about data self specifically. So we'll talk about business challenges that people look for data warehousing analytics. We'll talk about the pros and the cons of data warehousing analytics. We'll talk about generically speaking using tableau in Excel from a data warehouse. We'll show how tableau in Excel is enhanced by this framework. Then we'll talk about if you should do it yourself, starting from scratch, a solution, or if you subscribe to a vendor like dataself. That concept is going to be pretty much generic, educational and then the last portion, I'll focus specifically in data self analytics, data warehousing tableauxl how long it takes to deploy their self in overall pricing. If you have questions, please make notes because at the end of the session you can put your questions on the Zoom chat box and at the end of this webinar we'll address them. All right, so let's get right into it. Business challenges, why people look for or what kind of the challenges that people face that typically data warehousing and analytics, it's the way to go nowadays pretty much. You know, if decision makers are having challenges getting fact based decisions in a timely fashion, if they're complaining it's taking too long, too slow, they're making too many decisions based on gut feeling alone. That's the big red flag in more detail report complexity. If you're not using data warehouse analytics, if you're using Excel, crystal reporting services or tools pulling data directly from your sage 100 a common thread of problems is just complex to report directly out of sage 100. Even more if you have multi company, multi currency and other data silos Performance issues we have many clients that when we talk with them before a better BI solution, the reports are taking minutes, sometimes even hours to run. You know, people sometimes have to run reports overnight and next day the reports crashed so they have to wait for the next day to try to run the reports again. So performance issues is a big topic that that brings to data warehousing and analytics and also finally is a single version of the truth. When you're not Working with the data warehousing. Typically every report is built with its own rules, with its own calculations. Sometimes when you take two reports, they're supposed to be looking the same numbers and the numbers are different. And why is that? Well, it's hard to maintain a single version of the truth unless you design your rules, your KPIs, your metrics in a centralized database. And then reports are just putting the metrics out of it and not calculating everything inside of every report. So managing and defining single versions of truth can be challenging without a data warehouse. So these are very high level business challenges that people tell us when they're looking for enhancing and going to the next level. So first of all, what is a data warehouse and what the pros are? So a data warehouse is typically, you know, you pull the data from your source systems, you know, your sage 100, your CRM, I don't know sage or M. Salesforce.com, hubSpot, your payroll, your Google Analytics, anything. You bring over the data from the source systems into a separate database, which is the data warehouse. You make it easier, faster, and then you put analytics tools like Tableau Excel, Power bi, even Crystal Reporting services can also work better out of data warehouse. And then you render information to your clients. So the data warehouse is this layer between your source system and your reporting tools. What are the pros of using a data warehouse? Well, an ERP database like Sage 100 has been designed to be very efficient to do ERP transactions. You know, capturing invoices, your purchase orders, your journals, journal entries. It's good for things that are, you know, one transaction, maybe a few, maybe a few hundred, maybe a few thousand transactions at a time. And to get in, when you try to get information out of it, especially in bulk, like with reports, they're just not efficient. It's not Sage 100's fault. We work with dozens of ERP systems and they all have the same kind of database structure. Great for ERP purposes, the database structure, but for reporting, it becomes complex, it becomes potentially slow, and it's hard to have a single version of the truth. So that's the main high level reason why people need a data warehouse. Report complexity out of the source system, performance issues. Data consolidation is hard. And when you move the data out of it into data warehouse now, you can tweak, you can prep, you can massage the data in the data warehouse in a way that when you're pulling data out of it for reporting, things are simple, things are fast, and all of the data is together. You Know, if you look at sage100 and you want to see the several touch points of a customer, you know, you might have open sales, open sales orders, you might have invoices, you might have receivables, you might have CRM. Pretty much every one of these components have a report that looks at them individually. And if you want to see all the things together for all the transactions, it's just separate tables, hard to link. In the data warehouse, you can bring all the touch points of customers or products vendors, anything that you want to gather. So the data is easy, fast, together. So those are the main benefits of the data warehouse. And again, as I mentioned before, in the data warehouse you can create metrics. You know, how you calculate your revenues, how you calculate your gross profit, how you calculate your costs, anything that you define at the data warehouse level, it becomes a rule in a single place. And now all reports, all the metrics, all the KPIs, pull this calculation from a single location of the data warehouse. And then all reports will be much easier to enforce the single version of truth across all the reports that you have. So, major benefit, what are the cons of data warehousing? So first of all, usually the data warehouse is a separate database. So typically there is some, some actual licenses costs. In the past, data warehousing was very expensive. Nowadays, depending on how you build a data warehouse, it can become very inexpensive. So data warehousing costs came down significantly. Extra skill sets. If you have people in your organization that are dealing and building reports and dashboards, data warehouse is an additional layer of skill sets. Is no rocket science, it's not, but requires extra. So it takes more knowledge to be, to be good at data warehousing. But again, if you have good people already in the company doing database manipulation, typically the data warehousing is not a steep learning curve for internal know. Embracing it and data warehousing adds an additional layer to the reporting process. So now there's a database. So it takes extra time to set it up and to, you know, get it ready. The beauty is once you have the data warehouse in place, typically you can automate a lot of the reporting tasks that people do manually. So well, there's some extra time to set it up. Typically after that reporting, refreshing, automating, labor intensive tasks becomes easier, fast, becomes automated, and then, you know, becomes the benefit. So, but anyhow, Cron says some extra cost, you need more skill sets to maintain it, and it takes some time to set it up. Let's take a quick look at how a data warehouse for Sage 100 might look like. So I'm going to show a simple example of a data warehouse and I'm going to be showing a data warehouse in SQL server, Microsoft SQL Server, which is very popular in the Sage 100 world. For data warehousing, you do not need to use SQL Server, you can use Postgres, MySQL, any kind of database, even Microsoft Access is not great for data warehousing, but some people do it as well. Right now I'm actually using SQL Server Management Studio. I'm connecting to a cloud data warehouse. In this case, it's Data Self. But the point is, when you go to look at the tables on the data warehouse, typically you'll see things familiar of your Sage 100. So you'll see tables that are just like Sage 100's table, Sage 100 stables. So what's the point? It's just a copy? Well, initially, yes. Initially. The first step of data warehousing is copying data, just raw data from your Sage 100 into this separate data repository. And then after you copy, you do transformations. You know, you create more indexes, you denormalize it so you have more fields spread out in different tables. You can create your metrics, your special calculations, and then you can start gluing the pieces together. Let me show an example. I'm going to show now what is called a view in SQL. I'm going to edit this sales invoice view, which is already here, just to show the concept. But in the data warehouse you can link tables together. In this case is the sales header detail. The sales header, I'm sorry, the sales history detail. The sales history header, item table, customer table. I mean, you can link all of these tables together. In the data warehouse you can use views, you can use actual tables. There's so many things you can do in the data warehouse to make the data easier, faster for users. And then when you hit these tables and views using your Excel Crystal tableau, Power bi. As a user, you don't need to learn these table linkings, these things. You just hit the tables and you get them out easy, fast. This example is a simple example, again linking sales related tables, which are shown here. There's the SQL statement. But most importantly for users, what they really care is what comes at the bottom, which is the actual data where it's going to run fast. And the field names have been converted to something that is friendlier to users. No matter what table the data is coming from. The people maintaining the data warehouse will make this data easier Faster and very as self explanatory as possible for end users. So this is kind of how a data warehouse looks like. Very simple format. Some data warehouses are simple as this. Sometimes they only tackle a specific problem. Sales, financials, inventory. Some data warehouses, they have a lot of tables, can be hundreds, even thousands of tables. Some of them only one Sage 100 database. Or, or maybe a consolidation of multiple Sage on the databases, multi company, multi currency. So a lot of these more complex reporting needs can be addressed in the data warehouse. And once people have all them configured and glued together, that comes the fun part, the easier part. So let's talk about that going once the data warehouse is in place, already is up and running and customize your specific needs, how can you use tools like Tableau Excel to get the data out of it? So let's just to cover once the data in the data, what happens. It's a reporting database, so it has been optimized to get the data out. It's a single version of truth. All the metrics are being pre calculated. Typically when you build a data warehouse, you build in a way that when people open their reports in whatever the tool that they have chosen, the reports will run in seconds no matter how much data you have. In data self we have the rule of the 10 seconds. If a report takes longer than 10 seconds to run, you know, once you press run or refresh, it takes more than 10 seconds. Many users will not wait. So the report is kind of a waste of time if people now wait for the return of the data. So using data warehousing you can pretty much guarantee that report to running seconds no matter how much data you're handling. Behind the scenes data governance, there's a lot of people very concerned that data can get out of hand. And many companies use, let's say Excel as the way to distribute reports. Excel is a great tool, easy to get the data in. But from a data governance standpoint, it can be challenging because the data is in Excel. So if you email the Excel file to the wrong person, or if you have a notebook with a bunch of Excel files and it gets stolen, guess what? The data is all in there. So when you go with data warehousing in tools like Tableau Power bi, you have additional security layers to guarantee that is harder for the data got out of the right hands. And like using web user interface, unless you have the right credentials and you can even put multi factor authentication, the odds of getting loose control of your data is much lower. And data warehousing and analytics provide These additional data governance layers depending on what you want to do in the profile of your users. Natural language query is new technology. Fairly new technology is about 5 years old. Ish. Natural language query is pretty much like no searching for answers like in Google or Bing. You type in a question in, the tool will come up with an instant accurate report from scratch. Answer that question and we'll show that in a minute. An example and once you have the data in the data warehouse, reports become more kind of drag and drop, so you don't have to link tables. It's pretty much, you know, you drag and drop data parameters into report. So let's take a look some examples of how Excel works with the data warehouse and the Excel reporting. The good news, most companies use Excel a lot of Excel reports and again a lot of the challenges with the Excel reporting is complexity is low. This is just an example where when I showed you before I showed you this data warehouse and I showed this view that is gluing together sales, you know, the invoice, detail header, customer and item, and at the end of the day it gives this data here. Well, this is what Excel users will have access to. And that's what I'm showing Excel here. When you open the Excel, if you're a business user and you can be anywhere, if your data warehouse is in the cloud, for instance, you know, it can be on premises, but it can also be in the cloud. As a business user, you're going to a meeting which nowadays with the pandemic time is not, maybe not that common, but maybe if you're even from home and you need to look at a report, you just open Excel, you open the Excel report and you press refresh and then the data comes right off the bat. You don't need to go through VPNs, it's secured and you see the fields exactly as they were labeled in the data warehouse. So the data is clean, is simple and is fast. And then in Excel you can build your pivot tables, you can build your headers. So Excel reporting out of data warehouse, it's easier, faster and pretty much you can automate the calculation to run in the server, not in Excel. Therefore, reports will run in seconds because calculations are pre done beforehand. So Excel reporting easier, faster because of the data warehouse. All right, that was a very quick overview of the Excel. How about tableau with natural language and drag and drop reporting? So let's take a look at that. We'll start with the natural language query. So this is an example of a tableau Web reporting connected to sales data. The beauty is once you have your tableau framework, you can point it to any of your data sources. Like your data warehouse can have everything. So you point it to it. And natural language is typically something that is very empowering. But also it's like a journey. Just like searching on the Internet at the beginning. The first time that people start searching on the Internet, they cannot find the answer to their questions because they don't know how to search. But as they get the hang of it, eventually they become fairly self sufficient in finding answers. This is kind of the same thing. So let me show an example here. I'm looking at my sales data, a simplified sales data set and I want to see sales by salesperson in 2020. So what I do is I type in sales by oopsie, sales by salesperson in 2020. So you just type in what you want. The tool will use artificial intelligence machine learning to try to understand your question and will give you hits. The hits is like you know, a Google search and then you find which one is the right hit, you click on it and the tool will build instantly accurately a report answering that question. So this example buy salesperson is showing sales in a descending order in 2020. So ask the question, get a report. Let's say I want to see by month. So you type by month. The tool again give me the hits. I choose the right one. And now it converted that report, broke it down by month in 2020. And now each salesperson has a line chart and then I can see the sales amount by salesperson. So natural language query, an amazing technology. Some people when they see this, oh my God, you know, finally now we don't have business analysts. We don't need business analysts anymore. Not so fast. Whatever natural language query can address, it's this easy if you know English, which is the only language right now that is available for this framework. If you know English and you can articulate the questions correctly and the data is there, pretty much you'll get the answers on the fly. For the things that natural language can do today, there are many things that it cannot do. And I'll show some examples later. But anyhow, back here to this example. What if I want to see actually a table of numbers, not just charts? Maybe I don't like charts. You can usually pick and choose the representation. In this example I'm going to show a tax table. And now that report there was lines becomes a table of numbers. And what if I want to export this to Excel? Sure, you can select the data points and export just January, you tell the tool, show me the data. This is the data that I chose, just January. But I want to see all the underlying data. I want to see the actual records that add up to that particular January sales. And now I export it to Excel and then there it is, I got the data export to Excel in all the details. So natural language sometimes is very popular for the use of people where they use natural language to find answers to the questions, export Excel and they do further manipulation outside of it. So that's natural language. And again, I'm using the tableau framework for that. The second thing also that is powerful when you're using tools like Tableau or Power Bi is the drag and drop kind of functionality. And that's what I'm going to show you now, the drag and drop and again you connect to the data warehouse. In this case, I'm looking sales and I have a more elaborate data set compared to the natural language that I was looking before this report. Added or drag and drop is significantly more powerful than natural language. Here pretty much you can build any reporting dashboard that you want. I mean, you can be very sophisticated. You can have multiple layers, multiple widgets. And I'm going to show a simple example of building a dashboard from scratch. Suppose I want to see a sales by salesperson by year report. And then I want to see on a chart on the map sales by territory. And then I want to make this two widgets together. And then I want to interact the data between them and see when, when I select a territory what my actual sales by customers are for that territory. So let me build that from scratch and show how easy it is using the drag and drop functionality. So here are my sales information, all the data consolidated, the metrics already calculated in the data warehouse. So I don't have to worry about all the backend mappings. As a user I can read, I can understand what these fields are. I just have to know how to drag and drop. So when I bring my customer to my report, I put customers in my rows. I want to see sales, I bring sales to my report. So this is sales by customer in the whole company history. And I want to see only sales for the past two years. For instance, I can take my invoice date put in my columns. So by default it gives me my whole company history as part of my columns. But I want a filter to only see the last two years. Let's say show this as a filter and now we have a filter on the right. And then we can select only two years. So building a report from scratch is drag and drop one and click and you can do that. Many of data self clients using Tableau. Many of the users they saw a demo like this and they got the hang of the basics and then they start to become eventually more sophisticated sophisticated by learning the techniques. The basic functionality is really straightforward. All right, the next widget that I mentioned I want to see sales by territory, Ship to and sales. So go to ship to. I select my state, I select my sales. So I select both fields ship to state and sales and I tell the tool. Show me this on a map format and the tool will put bigger bubbles, bigger sales. And that was a simple report, simple way to look at information. All right, so I built these two different widgets or reports. How can I combine them together? I can tell to create what is called a new dashboard in Tableau. I'm going to make the size to be automatically fit to my screen. Whatever my screen size is. I want to put my first report anywhere in my dashboard area. In my second report I'm going to put on the right side so I have the map on the right and then I have the report on the left and that's it. I mean it took me five minutes here to explain how to build this from scratch. I can now save this report. It's already pre saved as a demo report. I'm going to save it. So now this demo report is called demo report has been saved. I'm going to get out of the edit mode. This is for people who know how to edit reports and dashboards. When I get out of the edit mode and now I am in the. Let me go back to my dashboard. Now I am in the viewing mode. So now everyone else that does not have know how to change reports, they can open the report, they can see the information and they can interact with it. Let's say suppose that I'm on a, on a, on a tablet and I want to see how I'm doing the west coast. Using my finger I could select the west coast states and then it will change and show which customers belong to those states and what the sales are. Or maybe on the northeast, maybe in the middle of the country. So with a few clicks quickly I was able to build an interactive dashboard and now become very self sufficient. So this is the power of leveraging the data warehouse behind the scenes. Plug in Tableau using the natural language and the drag and drop functionality. The last thing that is fairly common pain for Sage 100 clients is sending Reports to users on a schedule. Every day, every week, every month. Different users, different security, different data sets. With this framework, typically you can have a way to push reports to users. From an admin standpoint, yes, you can make very elaborate refresh schedules with security around to send information to people automatically. Or you can even let users to define some or all of their own consumption reports. Let's say I'm going to click as a user now, the subscription button. I can tell who's going to be receiving this report. I'm going to choose Clark, I'm going to choose Zach. I mean you just choose people. I want to include myself. I want to send only this dashboard or my whole workbook with all the reports. Maybe this would be a financial booklet with dozens of tabs having a lot of different perspectives. Yep, you can send the whole tab automatically, let's say by PDF on a schedule. Daily, weekly, monthly, you know, whatever the schedule, you just pick, you click subscribe. And now on this schedule, this booklet is going to be emailed automatically to all the people that you have selected here. So the distribution of reports can become completely automated and significantly easier to maintain. Alrighty, so that was kind of a quick overview of data warehousing and analytics platforms and how they work together. I know that probably you have a lot of more questions and absolutely we can have one on one discussions in case you want to go deep dive into some section of this whole webinar. Sorry, but in case you were interested in moving forward into this framework, primarily there are two main ways to do it. One is do it yourself, start from scratch. And another one is to subscribe from a vendor that provides those components kind of out of the box. What are the pros and cons of both approaches? If you do it yourself, be sure you have the right people. You know, it takes skill sets that understand Sage 100, maybe other data sources. You have skill sets for data warehousing. What tool should you use? What techniques going to be using, what ETL is going to be using? Deciding which analytics layer should you use. Excel Reporting services, Crystal Tableau, Power Bi Qlik. There's so many of those questions and then knowing how to onboard users. So be sure you have the people that have experience with this and then you'll get it done. Choose the right tools for your business. You know, tools that will make sense in the short term, that makes sense in the long run. Typically the data warehouse, the reporting, the analytics layers, it takes time. I've seen clients going through this journey and typically we're talking about months and years to build a comprehensive platform and also check at the end of the day how much you're going to get for how much money you're going to be investing. So absolutely many companies do it themselves, many successful, many not so successful. I think the main, the most important decision here is the people you know see who's going to be doing the actual building from scratch. Do they have experience, do they have resources to tackle? Be sure they stick around. You know, if you, if these people that have built your framework, they leave. I've seen many data warehousing analytics projects fail because keep people involved. In the beginning they were no longer there and then you know, it just, the project dies. So find the right, the right people and be sure to keep them around. An alternative would be to go with subscription. Subscription, you're going to be paying more for external companies to give you more, you know, more quickly. Typically you'll be able to see results fairly quickly and sometimes super quickly. So you know, you can, you can put a little bit of money, see what happens and then it's worth, you put more. If it's not working, you pull the plug before you put a lot of money and realize this is not a good fit. So typically subscription, you can see a faster roi, a more quick decide, is this the platform for the long run? It's easier to get to that decision typically. Also look for companies who can provide you personalized ongoing support. I tell people that BI analytics data warehousing is no rocket science. It's not. But if you don't do this for living, it can get, you know, it can require quite a bit of support sometimes. So having a vendor that can give you customized support is usually strategic for the long run. Especially as your people, internal people might change having the support externally. Usually they have a team of people that even if your internal people change, they'll be able to keep up, you know, getting your ball rolling even when you have those kind of changes. The last thing that I want to talk about if you, if you go with a subscription is check if the vendor provides you transition to go and do it yourself. Now maybe going to be growing your business significantly. You're going to get to a point where you want to actually hire a team of people to do business analysts, data warehousing and become independent from vendors. Maybe you don't need this, maybe you need, it's good to have options. So choose vendors that provide frameworks that are industry standard, that are using reputable tools that in case you need to take over These tools you can without having to be always giving money to your BI vendor. So it's good to have this option for the long run. So these are the comparisons between do it yourself versus subscription. Now let's talk a little bit more about data self analytics and what we bring to the table. If you have heard about us, we've been in the Sage 100 market for 16 years now. Sage 100 is still our number one market from a number user standpoint because it was the first one that pretty much we tackled. This is the architecture of data self. You see on the left the data sources and we cover a lot of different systems besides Sage 100, salesforce.com, sage CRM Dynamics, CRM, HubSpot, Google Analytics, Shopify, I mean we have a lot of different systems that we can easily bring to the data warehouse. Absolutely. Sage 100 we have, we covered, you know, financials, Apar GL, we cover distribution, sales, sales order, purchasing, inventory, we cover manufacturing, work order, bill of materials, and we also have custom work around a lot of these modules and some extra modules. We use SQL Server for data warehousing. The data warehouse can be completely on premises or it can be in the cloud. So it's your choice. We use our own ETL to make the deployment and maintenance super easy or easier. And then we use analytics tools like Tableau, Power BI and Excel as choices for you to get the data out of the data warehouse more quickly. We've been working with Tableau for about almost 11 years now, so we have a much more comprehensive solution with Tableau. We have more than 5,000 reports and dashboards in Tableau covering all those modules that I mentioned for Sage 100. And we're also building templates for Power BI in Excel, but pretty much out of the box. We can deploy this typically if you go with the entry level solution in literally half an hour we can get it up and running and it costs very little money and we'll talk about that later. Maybe you have heard about ETL plus. What is Dataself? ETL plus, what's the fuss about? Well, ETL is the main tool used for data warehousing. It's a very well established technology. We are at the heart a ETL company when we started 15, 16 years ago. But three years ago we decided to redesign our ETL from scratch. So that's what ETL plus is we launched last year. ETL plus is a completely redesigned from scratch ETL. It's easier, faster, more powerful, way more powerful than the old one. The Original one is still a young product, is about, you know, half a year old. But it's amazing. Whatever the tool already incorporates, it's so much more powerful than the old one. Let me give a quick demo of what ETL plus looks and how it works. So this is the ETL plus. It's a little kind of technical, but I'm going to take only three minutes to talk about it. You see on the left the source tables. In this case you're looking at the segment tables. We can work with SQL Source with providex with kind of database agnostic. Then you select which tables you want to bring data. If you want to bring a new table, Hey, I want to bring AP Division. You double click and now AP Division is over here with all its fields. That's it. You added a table to your data warehouse. It was just a double click. This is SQL Server. I'm sorry, this is SQL Statement language. Currently TL works with SQL statements, so if you know it, it's amazingly empowering. Let's say if you can look at some of these tables here, that actually joins. So if you know SQL Statement, you can do a lot of preparation and manipulation directly in the etl. The ETL also has ETL plus has a very robust delta refresh. Like in this example, I'm telling to update this table. Meaning every time that we refresh this table, we only bring the deltas. What has changed since the last refresh. So the initial load can be significantly slow if you have a lot of data, but an ongoing basis is going to refresh super fast. And then when you want to refresh your data, you tell ETL plus to oopsie, I click the wrong button. You want to tell refresh now. And you tell, let me just refresh Data Warehouse and run it. And then the refresh will run. It will take your local data. If you have a data warehouse in the cloud, you will push the cloud and all the data is over there. So that's a quick overview of ETL plus. What else do we provide as an out of the box? Let me show you very quickly. This is our tableau portal in the cloud with Sage 100 again, we cover sales, we cover inventory management, we cover manufacturing financials. We can bring other data sources like I mentioned, CRM, Shopify analytics, paychecks and whatnot. And we have lots of reports and dashboards out of the box. If you go with the advanced analytics, which is the entry level, we have dozens of reports and dashboards ready to go. I want to show some of Them if you go with the enterprise version, then we have thousands of reports ready to go. Let me show very quickly some examples. Let me reload the page. By the way, the advanced analytics that we have dozen reports and dashboards, they also cover primarily all the modules that I was talking before. And dashboards look like this one. Let me go to this dashboard. This is a year over year sales dashboard. So kind of, you know, busy. Yep. But once you look in detail you can see that you have your total sales this year, total sales last year, the various in percentage. And right now I'm looking the year this year being 2020, only the first six months. If you want to compare the whole year, I can select all the months of the year. Press apply and now it shows the total sales in 2020 versus the total sales in 2019. I can see by period how I was doing. Dark blue is this year, light blue last year. I can see by territory bigger bubbles, bigger sales this year. And if this red is declining so New York 5% decline from the prior year. I can see customers last year sales this year sales and the variance, same thing for product. And then I can quickly slice and dice the data. Look at this. This customer actually is declining quite a bit. What about it? If I choose this customer, the whole dashboard changes to show the totals, the trend analysis, what I ship to and what products. And I can tell that this product is driving most of the decline. So very interactive dashboards ready to go. It takes about 30 minutes to deploy this for a single Sage 100 database. Daily flash report very popular. You know many managers that they come to data self that they complain that it takes days, sometimes weeks and even months to find out that something important happened, something better, something good. Daily flash reports out of sales, out of financials, out of inventory. They give management a quick snapshot of what's happening yesterday or even today. So people get to know things that are important, not too late, pretty much on time. So they can act accordingly in a timely fashion. Let me show two more examples analyzing your aging AR aging AP aging Cash flow projection is also very visual. They're interactive. Hey, I only want to see my AR agent that is late. So I select only those three buckets. And now I can see the salespeople, the customers, the due dates, territory and all the details over here. Last one is financials. If you want to see your financials advanced analytics, the entry level provides a complement to your P and L and balance sheet including dashboards and things like this. The enterprise version provides full blown financial that can replace and enhance significantly your P and L and balance sheet analysis. All right, that was a quick demo of Data Self Analytics. So what about pricing and time to deploy? Again, if you go with Advanced analytics, which pretty much what I showed you today, I think everything that I showed you today would be available with advanced analytics. It takes 30 minutes to deploy and the price starts at 399 per month. If you go with the enterprise analytics, which is a lot more comprehensive, it has dows of reports and dashboards, then the deployment takes 30 days or more and the pricing starts at 1499 per month. What's next? To learn more, visit our website, email us or call us. We are Data Geeks. We love what we do. We love talk about data problems even if you go to somewhere else. So don't shy away from contacting us to learn more about data warehousing, analytics and how to take your Data Geek level the next how to take your Data Geek to the next level. If you want to order Data self, contact your VAR or Data self directly. You can even order Advanced analytics to reckon our website. If you go there, go to Sage 100 page. There's a deploy now button and you can quickly deploy it. We're running out of time unfortunately, so I'll skip the Q and A, but I'll check if there are questions and I will address by email. I really appreciate for you to join us today. This webinar is being recorded and we're going to be sending you by tomorrow the link to the recording session. Feel free to share with others. Thank you for joining us. I hope you stay safe and well. Have a great day. Thank you.










