Sage 300 Data Warehousing & Analytics
Johnny Girardi demos Data Self Analytics, a data warehouse tool for Sage 300that solves reporting complexity and performance issues. Advanced Analytics deploys in 30 minutes starting at $399/month; Enterprise takes 30 days and starts at $1,499/month. The platform works with Tableau, Power BI, and Excel on top of prebuilt dashboards.
Questions this video answers
Johnny Girardi, founder and CEO of Data Self / Data Sales.
About 16 years.
Approximately 30 minutes.
$399 per month.
About 30 days.
Chapters
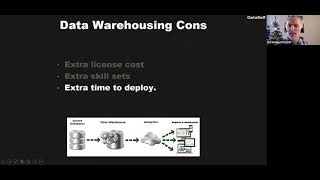
All right. Hello everyone. Thanks for joining us. My name is Johnny Girardi, Data Sales founder and CEO. Thank you very much for making the time today to learn more about data warehousing and analytics for Sage 300. We have a busy agenda, so let's get started. We'll talk about business challenges that are addressed by data warehousing analytics. We'll talk about the pros and cons of data warehousing. We'll talk about Tableau and Excel pulling data out of a data warehouse and how that works. We'll show you natural language query in drag and drop analytics when you're using functionality like Tableau. If you're interested in this kind of technology, you know, should you do it yourself or should you subscribe from a vendor? And then you know, this, this part is going to be all about education. And then we'll talk about data self analytics, which is the company that I've been leading for 15 years. Time to deploy in pricing. Please make notes and you can add your questions to the Zoom Chat panel and we'll address at the end, at the question and answer session. All right, so what are the business challenges that people face and they should be looking at data warehousing and analytics? Well, nowadays companies or management, when they're starting to get challenges, getting fact based decisions in a timely fashion, that's a big red flag why you're not getting fact based decisions in a timely fashion. Typically the culprits in a very high level is report complexity. If you're pulling data directly out of your data sources like Sage 300, typically building reports, distribute reports, validating reports becomes very labor intensive and very slow. So report complexity is a big challenge. Second challenge is performance. We hear many clients that when they run their reports out of their Sage systems, it takes too long. Too long can be 30 seconds, it can be minutes, it can be even hours. No matter what the problem is, if your reports are running too slowly, it might be time to go into the next level. With data warehousing and analytics, the last thing is the single version of the truth. You know, sometimes you look at two reports that should be looking at the same metrics, the same calculations. Your revenues and the numbers don't match. Why? Well, because typically you're building your metrics at every report. There's a mistake in the process on some different calculations. Guess what? You don't have a single version of the truth. You might have many versions of the truth. So when people start having this challenge of, you know, it's hard to see the Numbers. Which numbers are the right ones? You know, it might be time to get into data warehousing in analytics. What is data warehousing in analytics? Well, pretty much what I'm showing you here Quickly, as source systems like Sage 300, you probably have several other data silos. You know, you might have CRM system, Google Analytics, payroll, a bunch of Excel sheets, point of sales. No matter what, a data warehouse is a separate database that is focused on reporting only, but making reporting easy and fast. And then you can plug your reporting tools on top of it. You know, your Excel, Power bi, tableau and whatnot. So what are the pros of data warehousing? Well, a lot of the advantages is because the database of the source systems, they are not designed for reporting. Like Sage 300 is a database designed for ERP purposes. So you can quickly issue invoices, issue purchase orders, your journal entries, whatever you need to do in the ERP system, that's what the database is designed for. When you need to get data out, like for reports, then it's complex, it's slow, and if you need to glue the data together, it's just sometimes even impossible. It's very hard to deal with databases that are optimized for transactions, not for reporting. And that's the data warehouse for, you know, you copy the data into the data warehouse. Typically the first step is just make a copy, just mirror it. And then in the data warehouse, you can change, you can denormalize, you can add more indexes, you can glue the pieces together in a way that if you need to look at reports out of your database, the data is clean, is simple, and it's fast to retrieve. And then again, when you use your reporting tools out of data warehouse, much easier, much faster. So that's the main reasons why people go to data warehousing. Of course, this one is a big one for some companies. In the data warehouse, you can define how you calculate your revenues, your gross profit, your net profit, your cost of good, your services. Whatever you do, you build a single rule in the data warehouse, and all reports should pull that metric from the single location. So all reports will have a single version of the truth. It's much easier to enforce the single version the truth when you define the rules at the data warehouse level and not at the reporting level. The reporting level just makes slices of the KPI. But the definition of the KPI is done in the data warehouse. So those are the main pros. What are the main cons? Well, first of all, huge data warehousing requires an additional layer, the data warehouse. And there's additional some kind of cost for the data warehouse. In the past, data warehousing was very expensive. Nowadays you can have data warehouses very inexpensive. The cost came down significantly. Typically requires additional skill sets. You know, if you have people in your organization that knows how to do reports, you know, I don't know, in Excel reporting services you already have a lot of the skill sets required to do data warehousing. But it takes another layer to become a data warehouse savvy person. It's no rocket science, but it takes additional skill sets and it takes time to deploy. You know, if you build it yourself, it can take months and years. If you get from vendors, it might take minutes, but it takes some time to deploy that. You also have to factor into your decision making process. So these are the main cons of keeping a data warehouse framework. Let's take a quick look at an example of a data warehouse for Sage 300. And I'm going to be using a data warehousing Microsoft SQL Server, which is one of the most popular frameworks for Sage 300. I'm going to keep this conversation very high level. So even if you're not technical, you probably can understand the concept. So I'm not going to dive deep into it. So first of all, this is the management studio for the SQL Server data warehouse. And here you can see the tables that have been copied from Sage 300 into this data warehouse. So you can probably see familiar names and you can see some other names. What about this? Well, as I mentioned before, in data warehouse, typically you make a copy of the source data into the data warehouse and then you optimize it for reporting. And that's what you can kind of see here. You know some of these tables as you can, if you know these tables, you can tell, yeah, these tables come from Sage 300. Yep, that's it. That's it. But then there are other tables that are not in Sage 300, but they are aggregations that are done in data warehousing to make it easier. Let me show an example. I want to go to this called View, a sales view. In the sales view, we have glued together six tables that have invoice detail, invoice header item information, customer, salesperson, location information. They're all glued together using SQL Server statements. If you're not technical, what really matters to you is the output. The output of all of this technical thing is this clean table that has everything that you might care about your sales. So no matter what tables you need to Be gluing together at the end of the day, as a business person, when I, when I want to pull my reports, when I slice and that's my data, this what I care my numbers and looking at labels that are descriptive. So I don't need a manual to understand that this is my quantity shipped, this is my sales amount. It's right there in front of you. So data warehousing is like this. Make a copy of data, use data warehousing techniques to optimize, to clean, to make, to enhance it, to glue it and to make it easy for reporting and make it fast. So when you run it, it runs in seconds. So that's a very quick overview of how a data warehouse looks like from Sage. Now, how do you see the data warehouse data in tools like Tableau in Excel and what are the benefits of doing this? So first of all, just to review again, when you're using Excel and other tools out of the data warehouse, well, now is a reporting database with all the benefits we discussed previously. It has a single version of truth. All the metrics are previously calculated. You can set up procedures in the data warehouse. And when people run a report, you're just getting the data out. You're not calculating anything. Meaning the time it takes to get the result is usually seconds. Now we have a ruined data self that if a report takes longer than 10 seconds to run, most likely most people will not wait to see the result, therefore that report is usually useless. What we're saying is in data set for rule is all reports must run in seconds. No matter how much data you have, no matter how much processing must be done, when the person opens the report, it must run instantly or you know, 10 seconds is the benchmark. And usually when you use data warehousing and tools like tablet Excel and if you turn the dials correctly, you can deliver in that speed. It's no magic. It's technology. Data governance a big topic for some organizations, you know, very concerned about losing control of their data. And many of these companies using Excel as a reporting tool. Excel is amazing for a reporting tool. And with the data warehouse you have more security controls. But even tell people if you're really concerned about data security and you use Excel as a main reporting tool, it's just too hard to control security. No, Excel has the data and if you email the report to someone else, it's gone someone else's hand. If it's the wrong person or if you have a bunch of Excel reports in your notebook and it gets stolen, well, the data is all in there. When you use other tools like Tableau and Power Bi whatnot, you have web user interface and then you can control who can access the data. So you know, unless you have credentials with multi factor authentication, nobody will see the data. So it's much easier to control data governance when you use data warehousing in these more elaborate reporting tools. Natural language query is a fairly new technology. It's about five years old. Ish. And it's amazing how powerful you can let some users build their own reports just using plain English. You need to know English, currently the only language supported as far as I know. But if you know English and if you know how to articulate the questions, you get a lot of answers just by typing, like, you know, searching, like searching the Internet using Google or Bing. And when you have the data warehouse behind the scenes and all the things have been linked reporting in Excel, tabooing tools like that becomes drag and drop much easier. A lot more users will be able to do slicing and dicing without calling for IT support. So let's take a look at how Excel reporting works when you plug from a data warehouse. So now I'm bringing Excel and actually when you look at Excel, unless you're more technical, probably not going to see what's happening behind the scenes. But typically what I'm looking at here, this table here is actually the sales invoice table that I was showing you before. You know, that it was all linked together with the data warehousing and all of these things that data warehousing people do. But as a user, what I really care is the data coming out. And if you look at the data here is the same data here, nice descriptive names. This report is going to run in seconds. And of course here, once the data is in Excel, you can build anything that you want. You know, you can build the yearly, the quarterly, the monthly, the year, today, the pivot tables. The beauty is it will run fast and it will be more secured because the data warehouse control the rules and the security. So Excel reporting with data warehouse data warehousing, a lot of those benefits in that perspective, Moving along. And actually this is also supposed to be the natural language demo as well as the drag and drop. So let me go to that part of the demo. Let me just reload this page. What I'm going to show you now is the natural language query functionality pulling from data warehousing as a source, feeding your natural language. And let me reload. So just recapping natural language is natural language query is you write something In English. The tool uses natural language, artificial intelligence and machine learning to try to understand what the human typed. You will try to see in the model of the tool if it has parameters to answer that question in assuming you articulated the question correctly and the tool can understand your question and find the data points, it will build instantly and accurately a report for that question answering that question. For instance, right now I'm looking at my sales data. I can look at any data in the data warehouse, but I'm looking at sales right now going to ask sales by salesperson in 2020. So I ask a question, the tool makes sense. Give me some options like hits in a Google search. You choose the right one and that's when the magic happens or the technology happens. The tool built instantly accurately a report showing by salesperson sales. It put in a descending order in 2020. This report did not exist before it was created from scratch. To answer my question and I can go on break it down by month again, select the right hit, click it, the tool change and now buy Salesperson is showing a line chart with sales based on the months of 2020. It's amazing, empowering. Maybe I don't like charts. I want to see a grid like, you know, Excel. I can choose a different graphical representation. This case I'm going to choose text table. And now I see numbers by the penny. For some people, that's what they want. And some people use natural language to export to Excel. Let's say I can choose, generate numbers, all of them. Then I tell the tool, show me the data. So now I only have generated data, but I want to see the underlying data, all the records, everything behind those numbers. And now I can export Excel and then quick and easy to get an answer using natural language and then getting that data into Excel. So natural language, super, super empowering. It does not answer all the questions, just like Google, right? Or Bing. But if you can answer, you will answer instantly inaccurately. As long as you articulate the question correctly and the tool can connect the dots and answer. It's amazingly empowering. And it's becoming better. You know, every year this technology becomes better and better and better. Now what I'm going to show you now next is what is natural language Design does not answer my question. How can I build more elaborate reports and dashboards? Well, that's how when you use the report editor and I'm going to be showing tableau report editor. But with this report editor and the tableau functionality overall, you can build very elaborate, very complex reports and dashboards in A lot of them actually is pretty easy. I'm going to show an easy example, but not a simple example. It's actually a fairly good example. To show how easy it is, I'm going to build a dashboard with two widgets. One showing sales by customer the last two years. And I also want to combine with a sales by territory, you know, sales by ship to state, in order to make this a dashboard that is interactive, that I can point and click and filter things on the fly. So let me show how it works. So right now I'm looking at my sales data and. And I want to see customer sales. So take my customer. I put in my rows, by the way, I need to reload it, Take my customer input in my rows. So there it is. These are my customers. I want to see sales. So I take sales and drag it to my report. Sales by customer and I want to see by year for the past two years. So I take the invoice date and drag and drop into my columns. So right now I see sales by year and I want to tell take my year and show as a filter. So now my filter is on the right and I only want to see the past two, the last two years. It's pretty easy, huh? Drag and drop. And you can build reports. You can build a lot of reports using drag and drop, like I just did. Many of our clients using Tableau, they saw a demo like this and they got the hang of it and they became fairly sufficient in doing at least the 80% of the dashboards and reports that require 20% of the skill set. That's what this does really, really well. All right, so this is one of the reports. I want another one. And I create a new sheet, like a new Excel tab. Just an example. You know, I have the two sheets now. In the second one, I want to see ship to. I want to choose state, I want to choose sales. So I choose both state and sales, and I tell the tool, show me this on a map. And there it is. I have bigger sales, bigger bubbles. So I have sales by state, using the bubble size as to represent the sale size. All right, and now I want to combine these two different reports or widgets into a single dashboard and make them interactive. Sure. When I click now what's called a dashboard, and I make the size automatic, meaning it's going to fit automatically the size of my screen, whatever my screen is. I want to just drag my first report anywhere in my dashboard area. In my second one, I want to drag and drop into the right quadrant Right here. And that's my map right in the right quadrant. And that's it. I mean it took me a few minutes to build both reports. I changed the layout, now I want to save it. And I already have called demo report, but I'm going to save this report and I am in the edit mode so I can create things from scratch. Many users will not learn how to edit, they just want to consume reports and view reports. Let me get out of the edit mode to show how a regular user interaction would be. So let me click the exit button. So now I'm getting out of the report edit mode. I'm going to go back to the dashboard that I just created. So this is exactly what I just created. And as a user now I could be open this on a mobile device and let's say, hey, I want to see how I'm doing on the west coast. I could use my finger to select the west coast state and right there it filters the rest dashboard to show me how I'm doing. Those states northeast of the country, middle of the country. So very easy to build and interact with these dashboards. So this is the power of someone building the report and dashboard, publishing it to a web portal can be in the cloud or it can be on premises and then users can quickly and easily interact with it. Not only that, but one of the challenges of Sage 300 is to distribute reports to users. That process sometimes is time consuming, it's error prone, you know, have a lot of reports, a lot of different users with security. With this framework, you as the admin can configure how to email reports automatically to people based on security credentials. Or you can even let users define how they want to receive the reports. For instance, if I want to receive this report that I just created automatically, I can click subscribe button and I tell hey, I'm going to send this report to Clark, to Zach. I want to add myself. I want to receive only this report or the whole workbook. A work would be like a financial booklet with several tabs, could be dozens of tabs, each tab covering a different area of my business. Absolutely. You can get the whole workbook emailed as a PDF and I want to send this, let's say weekly, Monday, 5pm Pacific subscribe and that's it. From now on, on this schedule, this, this, you know, entire workbook will be refreshed and emailed to all of the people that have selected. So managing, maintaining, configuring report distribution usually becomes dramatically more automated than what most organizations are doing. You know that when they, when they look at something like this, they're spending a lot of time doing report distribution. And this can dramatically simplify the process. All right, there was a quick demonstration of tableau pulling data out of a data warehouse. Now, let's assume that you like this, you don't have it yet, and you'd like to know how you could move forward. There are two main approaches. You can do it yourself or you can subscribe if you do it yourself. First of all, be sure you have the right people to lead this process. You don't need rocket scientists. No, you don't. But you need people that understand your sage 300, your other data sources. They understand the basics of data warehousing. Also of the tool of your choice, Excel, Tableau, Power, BI whatnot, how to combine these pieces together, how to build reports and dashboard and onboard users. So people is a very important component of do it yourself. Which tools are going to be using? So the data warehouse framework, the reporting BI tools are going to be complementing your tools. You know, do your diligence to find the options. It takes time, you know, do it yourself. I've seen usually it takes months to years to build a comprehensive reporting platform from scratch using data warehousing, these other tools. So it takes some time. If you start from scratch and ultimately you got to see, you know, is it going to work, be worth it, you know, going from, start from scratch, how long is going to take to get some results usually takes longer. And put the numbers and see if you're willing to go the process. I know a lot of companies who do this do successfully and typically if they do successfully is because of the people. If you find the right people that know what they're doing, you get the job done. If you do it with the right people, do your best to retain them. Because a lot of, you know, failures in this project, as if people don't stick around and then sometimes the project dies because key people have left. So those are the pros and cons of doing it yourself. The alternative is to go with a subscription. Typically with a subscription you can get a lot of the things done in weeks, days, even minutes. So you can quickly get a hang of it. You know, will this work for me? You don't put a lot of money, don't invest a lot of time. You see the result. Is it worth it? Put a little bit more money, a little bit more time, a little bit more money, a little more time, you can pull the plug. If you think it's too much and usually you don't burn a lot of time, a lot of cash. So subscription usually gives you a lot of possibilities to evaluate ROI as you go, invest more if it's working, pull the plug if it's not working. So that's a good benefit of trying the subscription. First, be sure that the company providing your BI provides ongoing support. Again, it's very hard to find people that knows all the components. You know, Sage 300 data warehousing analytics tools, knows how to build reports, know how to onboard users. It's a lot of work. So hopefully the vendor provides you ongoing support to complement your resources so you can get the job done and maximize expertise of each, you know, each party involved in the process. Also, I highly encourage to get vendors that provide you with a way to transition into do it yourself in case you decide to take it over in the future. We at Data Self we have many clients that eventually decide to hire a bunch of people and do everything in house. Data Self is one of the vendors we absolutely provide industry centered technology a SQL Server. It's a blow up power bi Excel. If you want to remove the components or buy them, you know, we let you go, we train you and you take off. So having the possibility of being independent from the vendor in the long run is a major benefit or as a major backup plan in case the vendor doesn't prove to be of great value in the very long run. So check that out when you're subscribing to different vendors. All right, so all the things I covered so far, they are focused on the educational side of the webinar. Now I'm going to be talking about specifically about Data Self analytics. We've been around for about 16 years and Sage 300 was one of the first ERP systems that we tackled for BI purpose. So we have a lot of exposure, a lot of clients using data self for Sage 300. This is the architecture of Data Self Analytics. This would be your Sage 300 in other data sources. Again, you know, salesforce.com, hubSpot, Sage CRM, Google Analytics, Payroll, point of sales and whatnot. We use SQL Server as a data warehouse platform and we can use the cloud based system. You have nothing to install, I mean very little things to install on premises or you can also go full on prem in case you want to retain control everything behind your firewall. We use our own ETL that complements and usually replaces other ETL tools. And I'll talk more about it in a minute, but ETL stands for extraction, transformation, Loading is the mainstream technology to do deployment and maintenance of data warehouses. We support Tableau, Power BI in Excel as the analytics layer. We've been working with tableau for about 11 years, with power BI for about a year and a half. So we have a lot less exposure than Power bi. Nevertheless, we have an amazing platform for all of these three options. And if you go with Tableau we have thousands of reports and dashboards pre configured for a lot of different popular Source Systems besides Sage 300. Now. Data Self ETL plus what's all the fuss about again? ETL plus is this component here. Extraction, Transformation, Loading Data Self at the heart we are a ETL company, a data warehouse company. We've been doing this for 16 years. Three years ago we realized and decided that the initial ETL was designed before the cloud. And even though it was working in the cloud, it was not beautifully working with the cloud. It could be so much better. And then we decided to just let's design from scratch a new ETL that's going to completely be going forward looking for the future, leveraging all the greatest and latest. Let's use our experience we have learned for the past 12 years or so with ETL but let's not be backwards compatible, let's be forward looking. That's why this ETL plus is such an amazing etl. It's clean and lean, is amazingly powerful. It's still young, it was launched last year but whatever is already available is super empowering. I'm going to give a very quick overview of ETL plus. The current version is still fairly technical, very focused on tech yet but but eventually we're going to have a web UI within a wizard driven interfaces make it easier for non techies or not very technical people. In the meantime, if you are technical enough, if you know SQL statements. This is amazing etl. You can see on the left right now I'm connected to a Sage 300 database. So you see all the raw tables and you can have other data sources in the middle you have the tables that we have been added from the source into the data warehouse. In adding a table, super. You go to the table and you double click the table and the table is automatically added to the ui. And because I think I'm having Zoom is taking a little longer but there it is. The table has been added with all the fields and it's done that easy. Add a table, it's mapped here you have traditional SQL statement syntax. So if you know syntax you can go crazy with it. Just to show some examples this actually is a special table. The data warehouse that is an aggregation of several other tables. It's just a SQL statement. You can link tables, you can do unions, you can do filters, you can do transformations. Whatever you can do in SQL, you can do here. And the ETL will just execute it beautifully. Not only that, but we also have delta refreshes, meaning the first time we load the data we bring all the data. So it might take some time to do the initial push, but then after we can do delta refreshes like I'm showing here. So in this case it's looking at an index in a date field to only bring records since the last refresh. So typically the first refreshment take a while but an ongoing basis, the refresh will run super duper fast. Just so an example, if I tell refresh now and I click to refresh only the data warehouse, of course I'm working with sample data so it's going to be fast anyway. But even production system, the refresh is something that runs rather quickly and sometimes can run even during the day as you run your transactions, it will not be taxed into sage 300 will run fast and it will get the data to the cloud. And now you can do reporting out of the data warehouse and no longer affect the performance of your Sage system. So that's the etl. Let me show you a little bit now. A quick demo of what else we provide besides data warehousing and ETL plus. Let me go back here to my tableau portal. By the way, everything that I showed you so far has been using the data cell framework I was using showing the data warehouse, showing our data warehouse in the cloud. Then I showed you the tableau connected to our data warehouse how you can drag and drop. Now I'm going to be showing you out of the box reports and dashboards available with dataself. We have two main additions, the advanced analytics, which is simple and expensive. It takes 30 minutes to deploy. And I'm going to talk a little bit about the enterprise which is bigger with more options. But let me show you the advanced analytics. So this portal gives me a landing page that have my sales from Sage 300, inventory, management, manufacturing, manufacturing, financials. Then you can blend your data with CRM, E Commerce, Google Analytics, payroll, Monat and typically you just pretty much you point and click. Let's say I want to see my year over year sales. So you click the year over year sales and then you go to this other tab that shows me sales this year in dark blue. Last Year light blue, the variance in dollar and percentage. And right now this year is 2020 and I'm only looking the first six months of the year. What if I want to compare the whole year? I can select all periods. Press apply. Now I'm comparing the full 2020 versus the full 2019. And I can see the variances. I can see the dark blue this year. How's it going? And the light blue the prior year. I can see ship by state. The red means is a decline. So New York has a 5% decline in sales since the prior year. I see my customers last year this year in the variance. And the same thing for product last year, this year in variance. Look, one of my customers has a major decline. What about it? I can click the customer and the whole dashboard will change to show the metrics only for that customer with all the trend analysis. And I can quickly see that this product alone is driving most of the decline for this customer. What's wrong with that? You might want to know. And now you have information to dig in. So this dashboard, very empowering, out of the box and very interactive. The Pareto report, for some business super critical, Pareto is a way to look at the top 80%, the top 20% that affect your 80% of your results. So these customers, they represent 80% of the gross profit. This is the gross profit in a descending order. And this is the gross profit accumulating. And these customers below that as the light blue, they are not the 80% of your gross profit. And why this customer, which has a lot of sales is not as profitable as the other customers? Good question. Or maybe you want to see by something else. Let's see by product. And now they're probably showing by product and oh my God, why this product has so much sales and almost no gross profit? Could be normal. Maybe your retail, you're selling milk. Milk. You make almost no money because you want people to buy beer, right? So it's okay, but maybe sometimes it's not okay. And you don't know until you see this kind of trends out of the box report showing this ready to go. Another popular report that we have out of the box is the idea of it's not showing. Here is the idea of the daily flash. The daily flash idea is many management, they complain that it can take days, weeks and sometimes months to find out that something important happened, something really good or something really bad. The daily flash, it can be sales, it can be purchasing, inventory, payroll, financial. It can be any area. The idea is to keep your management Informed on a timely fashion. Maybe this could be the numbers from yesterday or today's numbers. And to see the big metrics and then the drill down into the subsections to tell people what's happening. We have this out of the box in many different areas. Let me show a couple of other reports. Ar aging for some businesses, super important to keep track of your aging. You see visually big picture, big numbers, different charts, all the details and hey, I only want to see what's old. 30 to 90 days. I select only those three buckets and now the whole dashboard only focuses on where the money is coming from by due date, by salesperson, by customer and all the details. Oh look at this. This customer has most of my late invoices. I select a customer then it will filter the whole thing. It should have also filtered my agent details in my demo here. Oh, there it is. Now it's filtering only for this widget. It showed me all the invoices that are late. So super duper to get to the answer. My last example here, Financial reports. The Enterprise analytics provides full blown financials to replace your P and L and balance sheet in case you're not too happy with them. Advanced analytics, which is an expensive product is a complement to your P and L and balance sheet. So we're not replacing yet, we're just providing you with visual ways to look at your financial data, your ratios, your charts and whatnot. But very interactive. All right, so that was a quick demo of Data Self Analytics. What about how long it takes to deploy in pricing of Data self Analytics? So first of all again Advanced analytics, which is the entry level product, it takes 30 minutes to deploy. So primarily I think everything that I showed you today is part of Advanced Analytics. Everything that I showed in my presentation, the whole thing is part of the data self analytics framework. It's very popular since we have deployed it. Most customers are Advanced analytics deploy in 30 minutes and the price starts at 399 per month. So that's very simple. If you have bigger problems, multiple databases, multi currency, complex reporting requirements, this usually a small number of clients might need to go enterprise. In Enterprise takes about 30 days to deploy and the pricing starts at 1499. Usually 20% of the clients stay on this bucket. 80% of the clients are using Advanced Analytics. So this is very popular. What's next? If you want to learn more about Data Self and data warehousing. Absolutely. Visit our website. We have a lot of information. Feel free to email us and call us. We are a bunch of data geeks. We're super excited about people looking to be more, you know, data hungry. So we like to educate to give some thoughts on how you can be more successful. And if we're a good fit, we absolutely can provide a lot of value quickly. So we are a bunch of exciting people that love to help and we do our best. We're not perfect but boy, in this market we've been around the longest I think or one of the few BI events have been around for a long time. And we use Gardner level technology. Our technology is used by Fortune 2000. So it's very empowering and amazing to work with our technology and our team. You can order Data Self directly with your var, with your Sage var, or you can contact us directly. You can even order advanced analytics directly on our website. You just go there, go to Sage 300, deploy now, fill out the form, credit card and pretty much you'll get an email with instructions and pretty much in 30 minutes the system will come up and running. So very easy to get the ball rolling. All right, before I open the questions and answers, just a quick overview of Data Self. So Data Self has pre configured data warehouse reports and dashboards for Sage 300. In many other systems it's easy to use and easy to customize. Pretty much run all reports in seconds. No matter how much data you have, it automates reporting tasks so most of the labor intensive reporting tasks will be gone once this framework is up and running. In the tools we use, they are Gartner endorsed BI components. I mean all the components we use except ETL plus. It's off the shelf in ETL plus is a SQL based tool. So if one day you decide to decommission ETL+ and build your own or use model ETL, you can copy the students from the detail + into whatever you want and run with it. So we don't keep you hostage, we make you successful with bi. Having said that, let me see if there's any questions. We're running out of time. There's one question here from Phoenix. What is the price for 15 users? Phoenix? Go back here quickly to dataself.com so go to dataself.com go to Sage Sage 300 and then scroll down on this page you're going to see the pricing sheet and then you can see how the pricing works or call us or email us in case you have more questions. Folks, we're running out of time so I'm going to wrap it. We are actually recording this webinar and you're going to be receiving an email with the link to the recording, so feel free to share it. Feel free to reach out and contact me or call us. Thank you much. Thank you very much for your time today. I hope you stay safe and well. Have a great day. Thank you.










