Sage Summit 2017 - DataSelf and Tableau preview
Johnny Girardi, founder of DataSelf, demonstrates their business intelligence platform for Sage customers. DataSelf combines SQL Server, custom data pipelines, and Tableau with a library of 5,000 prebuilt reports. Most deployments go live in days to a few weeks.
Questions this video answers
17 years.
More than 5,000.
Tableau.
Microsoft SQL Server.
From a couple of days to a few weeks; rarely months.
Chapters
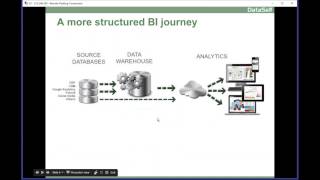
Happy hump day. My name is Johnny Girardi. I'm Data Self's founder and CEO. I've been doing analytics in enterprise BI for companies in the sage market. For 17 years. I've been around doing this. I know a lot of the BI options out there. Of course I'm an expert in what we have chosen. But I like to be a source of information, a source of education to help you decide what's best for you. If we are the right fit, awesome. Let's do business together, let's be successful. If we're not the good fit, I'll glad to tell other options that might fit you better. So I'm here to educate mostly and move forward. So I like to start this preview of the Sage Summit in Atlanta and Toronto with this slide. There are so many BI options out there. Which one is the right fit for you? It can be confusing. It can be even confusing for myself sometimes when I look at these vendors, exactly what they do, sometimes it's hard to tell. So I'm here to give you. I'm sorry, a kind of a high level agenda of what we're going to be talking at summit. One is generically how you can make your BI journey successful no matter what tool you choose. I want to give you some thoughts about how you can make this journey successful. And of course I want to talk about our approach, why we do it, how we do it and the kind of value we add for companies that use Sage products and other systems. So let's get started. The success of BI journey. How does it work? Well, there are three main ingredients to have your BI journey successful. Of course the BI platform is critical and what most people focus on is exactly on that one. What is the right BI platform? They spend so much time trying to figure it out. Yes, absolutely. Your BI platform is a critical component of your BI journey of a successful BI journey. But there's more BI expertise. Depending on what kind of BI platform, you're going to be the right fit. You need people who really understand the BI platform, who really understand your data sources and who really understand how to bring them together to give your decision makers really BI benefits. It's not rocket science, but depending on the BI platform you will need BI experts and sometimes even to select what is the right BI platform for you. If you don't have BI expertise, you might be choosing the wrong one. So BI expertise overall is also a very critical component to make this BI journey successful. Third, and as important, you need the decision makers engagement. They are the ones who ultimately get the benefit from bi, they need to be involved. You need to tell them what the thoughts, what the options, what the costs are. Sometimes you may think that an expensive solution is not the right fit and maybe that's exactly what they need. They have the business needs, they have the money. They should be involved in selecting, in helping decide how it will be rolled out, how many users, who's going to be getting what and whatnot. So decision makers engagement is critical. Once you have these three components in your BI journey, awesome. You'll be successful. It can be bumpy, but it will be very successful, very beneficial and your business will be in a much better level when it comes to the decision support system. So that's a very important slide to remember. Now, what is about reality? How is a regular BI journey? Let me show an example that I've seen over and over and over. Maybe you have a Sage ERP system or whatever the ERP system that you have and then you're not happy with the reporting available. What do you do? You try to find something better. You call your Sage ERP vendor and guess what, they're gonna give you a better BI for your ERP system and it works. Yes, you're gonna get better reporting out of it. You're gonna be happy. And you know, for many people that's enough, it works. Now sometimes for many businesses you may also have other systems, maybe a CRM system that is not Sage, I don't know, Salesforce or Dynamics and whatnot. And then hey, your sales team, you need to give them information, better information. And you need a better BI than is included in the CRM package. What do you do? You call the CRM provider the VAR and ask can you give me a better bi? And guess what? Most likely they're going to give you another BI solution that will do great with CRM. Awesome. Now you have a great BI for CRM and a great BI for drp. And maybe you also have a payroll system, maybe Google Analytics, maybe other systems that you guess what, you also need a better bi. And then the story goes over and over. You may end up with a lot of different BI systems, a lot of licenses, different people working with different systems. And sometimes you need information from one system to another and then these people don't know about this, this doesn't know about that. And it's a mess. It is complicated, it's expensive, hard to maintain, and sometimes with all this confusion of getting data across, you realize you actually need to scratch everything and start with a new system. For everything. You scratch your erp, you scratch your CRM, you scratch your payroll and you go to this very expensive new project that sometimes is really not worth it because the problem was really getting data across different systems for reporting. That's the regular BI journey. I see this all the time. It does work for many companies if they're simple, not sophisticated, maybe all that you need a little bit better reporting for your financials or for your sales or for your CRM, and that's it, you don't need anything else. It works for many people, but for many businesses, eventually this gets complicated. What is a more structured BI solution? Well, the reality is most organizations have several data sources. They have the ERP system, they, they have Google Analytics, usually payroll may be outside, they have Excel files looking at budget or quotas and whatnot, and inventory control system, manufacturing systems. So the idea that eventually you will need a data warehouse to bring the data together, to consolidate the data, to blend it together. So when you're reporting, you report out of a single data repository. It's all your business data, doesn't matter where it comes from. A data warehouse is a critical component for data consolidation. And to have a single version of the truth you define in the data warehouse, your main KPIs, how you calculate your gross profit, your sales, your inventory or whatever it is. Now all reports pull that information from a single location. So you're not going to go to a meeting where you're calculating, where you're looking reports that were that we're using different rules to calculate the metrics. You'll have a single version of the truth. So data warehouse usually becomes a solid and great foundation for a well structured BI solution. Then you need an analytics platform that will deliver the data to decision makers. This analytics platform should have a deep and wide range of BI features. It must be very easy to use because business users often they're not very IT savvy, so must be really easy to use, must enable people to access their reports and dashboards anytime and anywhere using desktop, web, mobile devices and emails. And it should run really fast. I mean you should run reports in seconds, doesn't matter how much data you have. So finding an analytics platform that fulfills those needs is critical. And when you go to this more structured BI journey, what you also need is people who can help you put it together. If you don't have the expertise in house, yes, you can grow it, yes, you can develop it, or you can partner with the consultants in companies who are specialized in the BI platform that you need and know your data sources to get this job done much more quickly and much more efficiently. So that's a more structured BI journey. Now before I jump into the data set approach, I'm going to run a quick poll here. So if you don't mind answering me these questions, just pick the main options and then be sure to click the submit button. 10 more seconds. Be sure to click the submit button. Alright, thank you very much. Let me share with you. So difficult to use is the biggest one. Not surprised and slow. Okay, thank you for your feedback. Now, what is the Data Self approach? Well, myself and my core team, we've been doing this for 17 years and we started to work with the Sage market initially and in 2005 we decided to create DataSelf. The vision was quite simple, it's just what I told you. If you're looking for a more structured BI solution, we say, hey, let's focus on that part. People who want a more structured BI solution in what we saw businesses that are trying to go in their route, they were having so many issues, they were choosing the wrong BI platform to get started. Eventually we scratch it, got another one. It was expensive, it was slow, they didn't have the BI expertise, they didn't engage the management team properly. It was kind of messy for many organizations. So I thought, hey, let's create Data Self and let's be the king of the hill in a way. Let's be BI experts, let's find one of the greatest platforms available out there, let's make it better, let's make it more affordable and let's help these companies get, get it going. So that's what we do. We do BI day in, day out. So we are BI experts. We have chosen a very solid and enterprise grade platform that works really well for a lot of clients. And because we have done this for so long, we have seen many clients building reports and dashboards that are generic that many clients need. So what we did is we actually start to take those templates and add to our library of templates of reports and dashboards. Today when you start with Data Self, yes, you get a great BI platform. Yes, yes, you have people who know how to put it together, but you also have a ton of reports and dashboards to get it going. So you don't have to start from scratch, you start from a very well developed BI platform that's Data Self expertise platform and out of the box. Now if you look at this architecture that I was showing you before, so we use SQL Server for data warehousing which is a very robust and well known platform for data warehousing. However, we do not use SQL Server Store procedures integration services. We don't need programming from SQL. Mostly we have our own extraction transformation loading tools that allow us or whoever's maintaining the data warehouse to deploy and to maintain it in a fairly code free environment. Again, make it easy, make it affordable. Then we have chose Tableau to be the analytics platform. And I'll talk more about Tableau in the next few slides. And finally, as I mentioned, over the years we have built more than 5,000 reports, dashboards and KPIs. So when you start with Data Self, you don't start from scratch one report at a time, you have 5,000. Many of the reports you need are very likely to be ready to go or just need a few tweaks to get perfectly the way that you want. So very valuable. Now let's talk about Tableau, which Tableau is this analytics platform. Why Data Self chose Tableau? Well, going back to the requirements that I told you that are very important for an analytics platform, it must be really easy to use. And Tableau has been considered the gold standard for ease of use for five years in a row by Gartner and I'll talk more about that in the next slide. But it's really intuitive, it's really easy to use. So we love that. Tableau also has a very deep and wide range of BI features, most likely things that you need from bi. Tableau has ways to do it. So it's very good to have a very mature solution in pricing. Yes, it's not cheap. No, it is affordable, it doesn't break the bank. So pricing is also a great fit for our market. So that's why we chose Tableau. Now this slide is interesting. Most of the BI companies besides Tableau, when they started their own BI platform, they pretty much started as software engineers and business people thinking, hey, look at these other BI vendors. We can do better, we can make it faster, we can make it flashier. Oh, look at this, I can make this different. Then they start to hire engineers and come up with a different BI solution. That's how most, or I would say all BI solutions out there that I know, that's how they started. Tableau started differently. They were actually, the founders were actually Stanford University professors and they were studying how business people look at data, business data, and have insights from it. You know, it's a journey, it's a process. They can smell something is good, something is bad, but until they dig to the data they don't know. So it's a process. And so these Stanford University professors, they hire psychologists, they hire graphic designers, they study this process and at the end of this multi year study they look at this and say, huh, we can actually make a software out of this study that will help decision makers to walk through the data decision making process journey without calling for experts. And then they founded Tableau and then they hired the software engineers. So they started from the right angle. What is the real problem? How can we solve the problem? And let's make a software to do it. If you look at Gartner, Gartner is one of the most reputable companies doing technology assessment for Fortune 2000 for enterprise grade BI solutions. In every February they release what they call the magic quadrant for BI analytics platform. And Tableau and Microsoft, they are the leaders. They are one of the best. They're not perfect, they're not magic ones, but boy, they're one of the best technologies out there for bi and that's exactly what we're bringing for the sage market. Best of the breed out of the Fortune 2000 world platform. Now let's jump into the product demo and I'm going to show a real case scenario. One of our clients, a distribution company here in California, the CEO, he told me that he called me with his CIO and he told me, Johnny, we are fairly large company. We are a very data driven, my decision makers are very data driven. We're struggling. It takes a lot of effort to put the reports together. We usually have to wait until we can make an informed decision or we have to wing it. And I want to get out of the situation. I want to be able to more quickly by myself, my whole decision maker team, exit the reports anytime, anywhere, make changes without calling and waiting for people. And I want to become more self sufficient. Can you help us? He said, I even go to my board meetings every month and we're spending a lot of hours getting my reports ready for the board meeting. And quite often in the board meetings, board members ask me questions that I don't have the answer for. I don't remember, it's not in my reports. And then I have to make notes and I'll get back to you. You know, it's very unproductive. The CIO on the other hand, he said, you know Johnny, our problem is not money. In a way. We have resources, we have a lot of people, we have a lot of systems. But it's frustrating because we're always behind the requests. We don't have time. It's complicated. A lot of manual procedures. We want to automate things. We want to focus our IT expertise in giving more value, not so much labor, repetitive mechanical reporting things. So eventually they got it itself. And what I'm going to be showing you here is actually what the CEO built himself. One of the dashboards before was taking a lot of hours from different people he built himself. And I'm going to show you how he did it from scratch. And this dashboard he built from himself. I'm going to make the example shows three main areas. It's for the board meeting he has every month. One is showing this month sales details. He wants to see sales by customer, by product, invoice number, invoice date numbers by the penny. So a very detailed random report. Then he needs to see marketing sales trends. They do website campaigns and that affect their sales. So they, they want to keep track over time, over the company history, how the website campaigns are affecting their sales. And then finally I'm going to be showing also a geography analysis showing sales by state and how large the deals are. So let's switch gears. Sorry. And now I'm connecting to the data self desktop application which is powered by tableau. What I'm going to be showing you here on the desktop application can also be done using web and mobile devices. And the CEO came here to build this dashboard from scratch. And the first decision is out of this data panel what connector he's going to be working on. And here, show me some of our out of the box connector for Sage and SAGE or M systems. No, AP, AR, CRM, GL inventory, purchasing, sales, sales order and whatnot. Well, in this case he was looking at revenues, he was looking at his sales. So he selected sales. And well, the first report he needs is detailed sales this month. So how did he do it? Pretty much if you know how to drag and drop, you can do a lot of the reports. So in this case, he found the customer name. He just drag and drop the customer into the report. So these are all the customers. And now he needs to see sales. Sales is right here. Just drag and drop. And there it is. Now I have sales by customer in the whole company history. Well, I need sales this month. Okay, let's take invoice, date and just drag and drop into my columns. And right there I can see sales by year. If my database would have 20 years of worth of data, I'll be seeing 20 years worth of data. Right now I only have a few in my sample database. Well, I want to See sales this month. So let's expand from year and go to the quarter level. Let's expand quarter to go to the month level. And now I'm looking sales by month. Very easy, very straightforward, awesome. But hey, I only want to see this month. No problem. Just drag and drop invoice date into my filters shelf. And when you drag and drop the tool ask you how do you want to filter by date. You have different options, different buckets. I'm going to choose relative, which is very popular. And then I select month this month and there it is. Beautiful. Now this report will open. Always show sales this month, whatever the month is. Next month when I open it's going to be May 2017. And guess what? If I want to change to a different month, I can come here and say, hey, show me the previous month or maybe show me the last, I don't know, three, two months. Or maybe I want to see by quarter, by year, by weeks. Once you build this foundation, it's even easier to start to slice it. Let me go back to this month. Well, I want to see sales by customer, by product, invoice number, invoice date. I just need to drag and drop. So I go to, let's say product, I find the product name, I drag and drop between customer and sales and voila, by customer, by product I have my sales. Maybe when I see, I mean I want to see invoice number, invoice date. As long as you can find the field and you can use the search if you want to. You just need to drag and drop invoice number is right here. I'm going to put between customer and product. There it is. Invoice date. Sure. Again, if you know how to drag and drop, you can do it. About 70% of the custom reports that people need, they can do it. If they know how to drag and drop, point and click, they can do it. It's really intuitive. It's this easy. Okay, that was easy. Now let's go for the second report for the dashboard for the CEO, the second report is showing trend analysis. He wants to see sales and website visitors side by side. Website views from Google Analytics before data Self this report alone was taking about two days of his IT and marketing team working together to copy the data to Excel Massage the data, tested it, compare it and eventually it would be ready. It's a very manual process, very time consuming and very limiting. Well, we work with their team to bring Google Analytics analytics data into the data warehouse and we blended the website visitors with sales looking invoice date and website visit dates as the common denominator. It was a technical work, but once we did it became completely automatic. Now every day they just come and they see the reports and what I'm going to be building is what the actual CEO did. He double click sales so he sees this whole sales for the whole company history he wants to see over the months. So he double click invoice and right now he's seeing sales over the years. And then he say actually I want to see by month. There it is. Now it's showing sales by month for the whole company history and website visitors is right here is just part of my revenues connector. It and data self took care of blended. As the CEO, I don't care. I know they have edited. I just have to know how to drag and drop. So I take website visitors, I drag and drop into my report. These are website visitors. Let's make bars. So they're quite different than my sales. And let's put on a dual axis. And there it is. Now I have website visitors as the orange bars and sales as my line. And then I can see how long it's taking from my website campaigns to bump up my sales. This is not their data, but kind of similar to their data. So I'm just showing you how easily the CEO built himself these things in how the data looks on his dashboard. The last part of the dashboard that I'm still putting together the pieces is geography analysis. They want to see on a map, sales, big sales, sales by voice size and how large they are by state. You can plot on a map anything that has an address. In his case, he chose the customer state, he chose the invoice sizes and sales. And then he told the tool, show me this on a map. And there it is. In a map is the information, bigger bubbles, bigger sales. And the bubbles are sliced by how large the invoices are. So in a few clicks he can see the perspective. And then he wants to see this over the years, is it growing or declining? Eventually he came up with this approach where he can actually use this slicer that changes the years and see how things are growing over time. Very cool. He can even say this, hey, put in a loop, playback, press play. And then he can just sit there, relax and see how things are changing, you know, as the years changes. He see what's going on with the sales. Very informative and very cool visualization. Okay, cool. Now we put these three dashboards, these three reports together. But he wants to see this on a dashboard on his iPad because he goes to the meetings now with an iPad and in a sack of paper because guess what, some board members, they like the papers. So he has still both approaches. And then on his iPad he just built the dashboard. He took the map, he put on the dashboard, he took the trend analysis and he drag and dropped into the bottom of the dashboard. He took the revenues report, drag and drop to the left side and then he make this a little bigger. And now when he goes to his board meetings, sometimes a board member would say, hey Mr. CEO, I don't have an iPad and whatnot and I'm visiting the west coast. How are we doing over there? In the past the CEO would likely have to make notes and I'll get back to you today. You know, if that board member doesn't have, doesn't have, let's say a tablet or a computer, with him the co can take on his iPad and with his finger he can circle the states and right there he got the whole dashboard to change to see how they're doing. He can export this report to that particular, actually let me put here 2017. He can take that particular perspective, export to a PDF to an email and send it to the board member right on spot. So again, giving them power so they can make decisions on the spot, answer more questions in a timely fashion, make more informed decisions and become more efficient. All right, and let me see here. Okay. And by the way, you know this report here again he published this report to his portal. So all the people who have access to the dashboard, they can access using web and mobile devices, even smartphones and see this kind of information in a secure manner. There are so many ways to slice and dice your data to drill down. You can drill down to the level to the details. You can see let's say a spreadsheet showing all the details behind every data point. Here you can spin it in different ways. I don't want to overwhelm you with the details today. I just want to give you a high level perspective. If you want to learn more about it. We can go on a one on one session and can show you so many great things that this tool does, but it's really intuitive. Let me go Back to the PowerPoint. A common question people ask about data self is how much effort and how long does it take to go live. So typically what we do when we engage with a new client, we deploy the out of the box solution. So we put the data warehouse, we put the tableau server, we take the templates, we connect to your SAGE system, other data sources, we blend them together, we test it ourselves, and then we show it to you. Usually part of this work there's also some customizations. The out of the box is a great generic platform, but quite often you have specific needs not met. So we do some customizations on the back end and then we do training. How long does it take to go through that process? Believe it or not, it can take only a couple of days. Many clients we have done that in two days. We get it all deployed. Most people, it takes more time, sometimes a few weeks, rarely months. It depends on specific needs, it depends on what you're looking for. But again, it takes from two days to a few weeks. Now, among all of the BI options available out there now, remember when I started, I showed this slide with a big question mark with a lot of options. Why would you consider Data Self analytics? Well, these are the three main reasons. In more detail, we have a great, one of the best BI platforms out there because of Tableau in the SQL Server data warehousing. So it's really solid. We know a lot about our stuff. We only do this day in, day out. We know Sage data sources a lot, we know a lot about Sage. Companies use Sage and we have a lot of reports as a starting point. But at the very end of the day, you can do it. You can do your own bi, you can get tableau, you can build your data warehouse, you can get other people. Why would you really choose Data Self in a single word? Time. If you're going to be building from scratch, if you're going to be learning how to do things, it's going to take you time and time is money. Not only is it going to cost you to go through the process to select the BI tools or build things from scratch, but how much opportunity is going to miss because your decision makers are not going to get at their fingertips quickly their information. So at the end of the day, what we do is we dramatically reduce the time that it takes to get value to decision makers and will help your IT team and BI team to get a lot of value from this platform very, very quickly because we do have expertise. What's your role in selecting a BI platform? If you're doing that, if you're selecting a BI platform, what's your role? I would say that if you're not looking closely at Tableau and Data Self, you're potentially doing a disservice to your organization. If you're looking for BI or if you're a reseller to your Clients. Because if an organization really needs something like tableau, we might be it, we might have the solution. Maybe not. If we're not great, there are other things. But if we are it, I highly recommend you bring us to the table. Let's talk, let's show, let's see if it's a great fit, make a decision, yes or no and move forward. So at the end of the day, we want to help you succeed. If you're not a good fit, we're going to tell other people that you can go to. But we are a good fit. Don't do a disservice to your organization. Call me, send me an email, let's talk, let's schedule things and see if we can be of help. What's next? Well, if you are looking for bi, assessing BI options or if you just learn about it, if you're curious competitors how they stack against us, call me, send me an email again. I'm here to educate first and most importantly. So feel free to contact me to discuss your plans, your thoughts. If you want to test data self, we can use demos with our sample database. Depending what kind of data you have, we can do proof of concept with your own data. So we have ways to show the concept. If you are getting close to order data itself and you need more information details, why not contact us, contact the reseller, let the get the ball rolling and if you're going to submit, please stop by. I love to talk with people to learn about their plans, BI plans, their struggles, their successes. Again, if you're using competitors, you're super happy. I love to hear the stories. I'm here to educate. I'm here to become a better person and help help you with your journey. So with that in mind, I hope you found this informative. If you have questions right now we have about 10 minutes to address. You can use the GoToWebinar panel. There is a question section so you can post questions over there and I'll be addressing questions. So let me see here. The first question is from Carl. What Sage ERP Systems datasoft support Carl, thanks for your question. Let me answer this question by going to my website. So if you go to dataself.com and go to Solutions and you choose Analytics, ERP and CRM you go to this page that shows all the ERP systems and CRM systems that we have out of the box connectors for. So if you have any of these systems, we connect right out of the box with a lot of value. If you have something else, absolutely Our solution can work. We can work with any data source. These are the ones we have a lot of out of the box reports and dashboards. Carl, thanks for your question. Let me see more questions. Question from Susan how do you compare with Sage Enterprise Intelligence? Susan, great question. We get this question a lot. I don't like to make generic comparisons in a public forum like this, but let me give you an insight that I like to use as a starting point. Gartner does this assessment every year and they use certain criteria to select BI platforms to be on this BI magic quadrant. The main criteria is is this BI solution enterprise grade? And they have certain criteria to define what is an enterprise grade platform and overall, if you meet those requirements, then Gartner starts to assess you and compare you against the other players. Sage Enterprise Intelligence, which is powered by Tangerine Nectary, is not here. I don't know exactly why they are not here, but overall, based on Gartner criteria, they're not a true enterprise grade BI solution. It's a great solution. Let me tell you, there's a lot of people using Sage Enterprise Intelligence that are very happy. So let me tell you it is a great solution. But data self we really target to have one of the best technologies that are enterprise grade. And having Garner telling that tableau Microsoft BI is a leader for us is like, no, hey, it's awesome to be in this position. It's not a magic wand. This is not going to make all your wishes come true. It will not. But it's as close as it gets. So what I tell people is if you're really looking for something top notch, we have a great platform, we cost significantly more than sei, but we do not break the bank and the value is there. Susan, thanks for your question. Let me go back to my slide here. More questions. Let me see here a question from Josh. What sage 300 sage 300 versions do you support? Josh, good question. Let's go back to my website and again, if you go to the solutions ERP where I was and you select the product that you're asking for, which is sage 300, click on it. Usually we have this information right here. So we go Back to version 4. Most of the systems we support versions that go back 10 to 15 years ago. So we support a very wide broad range of versions from source systems. So Overall, if it's 15 years or younger, most likely we support as a general rule. Josh, thanks for your question. More questions Mary is asking here. What exactly is the 5000 reports and dashboards out of the box. Mary Good question. Go back to my data self again website and under solutions there's the 5000 KPIs. Oopsie, I clicked the wrong button. So 5000 KPIs selected. This page with the 5000 KPIs lists what we call the reporting package available. So we have reporting packages for CRM, reporting packages for ERP, and how many KPIs which is reports and dashboards are included. So this is like a brief description of what they are and what they include. If you click this download full list you'll get an Excel file that lists individually all reports and dashboards included. If you want to have an idea of how they look, you can click this Dashboard Samples Right now we have mostly sales related samples. We're going to be posting a lot more in the near future. But here you can have an idea of how these reports and dashboards look. It's just a sample. We have a lot. This shows how it shows. Overall folks, we are running out of time so I'll just wrap up here. This is my contact information, my cell phone and my email again if you want to discuss BI plans, competitors, market landscape, what's happening with the AI in the BI whatnot, I love those topics. Feel free to send me an email. We can schedule a call. If you're looking to assess data self learn more from it. I'll be very happy to take you through the process and see if it's a good fit again. If you go to Summit, we're going to have a breakout session. I think it's on the second day and we're going to have a booth as well so please be sure to introduce yourself. Is good to connect in person and attach a name to a face. If I haven't met you yet, I hope you have enjoyed the session. I hope you found informative. Have a happy hump day and looking forward to seeing you at Landa. Thank you.










