Sage X3 Data Warehousing & Analytics
Johnny Girardi explains why Sage X3 users build data warehouses and how Excel, Tableau, and Power BI connect to them. He demos a SQL Server warehouse with Tableau dashboards and natural-language queries, then walks through DataSelf's ETL tool, prebuilt templates, and ready-made reports.
Questions this video answers
Johnny Girardi — founder & CEO of DataSelf.
March 24, 2021.
Microsoft SQL Server.
ETL Plus.
About 30 minutes (entry-level/Advanced Analytics deployment).
Chapters
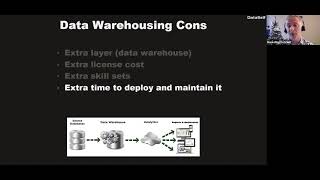
All right. Hello everyone. My name is Johnny Girardi. I'm Data Sales founder and CEO. I'm a big data geek and I'm here today to Talk about Sage X3 data warehousing and analytics. Thanks for joining us. Let's jump right into it agenda. We'll be talking first. You know why people look for data warehousing and analytics out of X3. We'll talk about data warehousing pros and cons. We'll talk about the analytics layer. Today we'll focus on Tableau in Excel pulling data from a data warehouse. We'll show the natural language query in drag and drop reporting for data analysis. We're going to be focusing on tableau for that part of the presentation. Then we'll talk about if you don't have this kind of technology data warehousing and analytics tools like Tableau, should you do it yourself from scratch or should you try to subscribe from some vendors? So talk about that. Then I'll talk about specifically about data Self, how we do it, time to deploy overall pricing and then we'll open a questions and answer session. If you have questions, please make notes and and you can use the Zoom Chat or Q and A section to post the questions and we'll address them at the end of the webinar. All right, so why people look for data warehousing in analytics out of x3? The most important reason is because nowadays decision making is becoming more critical. There's a lot of information in the X3 and other data silos and it's becoming more challenging to get fact to make fact based decisions. So time is very critical. When people using Sage X3 built in reporting, we hear a lot of people telling, you know, report X3 is complex. You have to have people with a lot of training. It takes a long time to do things. It's very time consuming. Some people complain about performance when they run the reports out of X3. The reports may run too slowly. Sometimes people can only run reports in certain time because they don't want to slow down Axe 3 operations. So performance is also a big topic that people complain and they come to data warehousing analytics. And the last one is what we call the single version of the truth in a company. You know, you have x3 and other data sources or the data silos, you know, maybe Payroll outside of X3, Google Analytics, CRM can be, you know, Salesforce or HubSpot whatnot. And people need to see all the data together for reporting. So having these challenges is usually where People look for how can I do better? So those are the main high level challenges. So let's talk about the data warehousing pros addressing those challenges and just give them a very high level perspective. You know, this would be your data sources. Like AX3 in other data silos. Data warehouse is a separate data repository that is designed specifically for reporting purposes. You can fine tune it, you can optimize it. So when you run your reports, they run fast. It's easy to run anytime, anywhere. So that's the main reason of data warehousing analytics tools you can use Excel, Tableau, Power, bi. Usually when you connect to the data warehousing, you can get data easier, faster, and then deliver reports and dashboards to your users. That's how the framework works when you add data warehousing analytics layers on top of your data silos. But what are the pros of this data warehousing? So the most important perspective is Sage X3 database is highly optimized for the ERP purposes to issue transactions. Your invoices, your purchasing orders, your jail transactions, one transaction at a time, maybe a few. It works beautifully, works great, it works fast. But when you try to do reporting out of this X ray database, you might run into challenges. It's complicated. You have a lot of tables, you need to link the tables. It can run slowly. That's because it's the nature of the beast. We work with a lot of ERP systems, not only actually in all of them, they have the same goal. It's a database for erp, not for reporting. So when you need to do better reporting, faster reporting, easier reporting, guess what? You need a separate database to do that part of the process. That's why a data warehousing is so valuable. It's a database with the only purpose to support the decision making process. So that's a very high level reason why it's hard to report out of your ERP like X3, and why our data warehouse is easier. So report complexity you can address by making the data warehouse easier, faster, simpler for users. So you address a lot of the complexity at that level. When you hit the data warehouse, you can optimize the database to run everything faster. There's a lot of dials, you can turn the data warehouse to make reports really fast. Overall, we tell people that if you're using this framework fine tuned, you can guarantee that reports will run in seconds no matter how much data you have. And if you, if you heed the data sources directly, sometimes it takes much longer, minutes, even hours to Run the reports. So that's a great benefit. Performance improvement. Data consolidation. Hey, you need to get data from actually different modules. You know, sometimes you're trying to combine data from your receivables with your invoices, with your sales order, with your inventory modules. And all these tables are separate, but you need to see them together in a report. Well, data warehousing can bring the data together and make it fast. Maybe you need to bring data from other data silos like Salesforce, CRM, whatever. Combine them. Well, data warehouse. It's a great way to bring the data together. And finally, the single version, the truth. Single version. The truth is you define a rule in the data warehouse that define your metrics, your revenues, your sales, your gross profit, your payroll metrics. You define that metric in a single place in the data warehouse. Now when you're building reports, you're pulling those metrics out of those single places. In all reports will show the same calculation, no matter who designed the report. So it's a great way to enforce the single virtual truth using data warehousing. And the final benefit is a lot of people do a lot of data prep using. Sage X3 reporting tools, Excel. They spend hours doing data preparation well, with the data warehouse. Once you code into the data warehouse, the data massage, now the computer will do for you regularly, automatically, so you don't have to. The idea is to remove repetitive tasks from reporting in letters. The system do it for you. So those are the main benefits of data warehousing. Let's talk about some cons, some downsides. So first of all, you add an extra layer to your reporting so you're not hitting the data source directly. You have one extra layer, so there's more things to be included. When you're using data warehousing, typically you're using some kind of tool to host your data warehousing. So there's usually some additional license cost. In the past it was very expensive. Nowadays you can start for free. And if you have little needs, small database size, it can cost you very little to have a data warehouse. So there's a cost, but it's usually inexpensive extra skill sets. Data warehousing requires more than just knowing the reporting tool. You'd have someone that needs to know databases and how to bring this database data from X3 into the data warehousing to maintain it. So it requires more skill sets and time to deploy and to maintain it. So these are more, you know, the layers you're adding to the framework. There's one more, which is the near Real time data. When you put a data warehouse, primarily you're no longer doing real time reporting. You pull the data from the data sources into the data warehouse and then you hit it. So it's not live, it can be near real time. Sometimes it can be overnight. So how you do the refresh of the data warehouse, how often can you do real time or not? Those are technical discussions you have to check with the data warehouse platform. But typically it's not. Real time is near, even though real time is also possible. So those are the cons of data warehousing, the main cons. So let's take a very quick look how a data warehouse for Sage X3 would look. I'm going to be using SQL Server as a data warehouse platform. Some people use other database formats, but I'm going to use SQL Server. By the way, in this webinar I'm going to navigate from very high level business concepts. I'm going to dive into some technical insights. If you're not technical, don't worry. I'm not going to spend too much time talking tech. I'm just going to show the basic mechanics of all of these components as we go through. This is a SQL Server management studio. Where I can see in this case is a data warehouse. When they look at the tables, these would be the X3 tables that we pulled or someone pulled from the actual X3 into the separate data container. Typically we do a mirror first. You copy a bunch of tables, you clean them up, you be sure they are accurate. You might add additional tables, additional fields, additional indexes, all the things you add after you bring the tables or techniques people use to make reporting easier, faster, more intuitive. So there's a lot of things you can do to make these tables easier, faster and cleaner for reporting. When you're using database like SQL, you can also have things like views. Views are simple ways for someone to glue tables together. And when you run the things, you can see the actual data using nice descriptive names. These are part of the techniques that using data warehousing you can convert the cryptid table names, field names into something that a business user can hit, look, report and be happy about. Just a very high level data warehousing, it's separate database. You copy everything that you need, you improve it, you fine tune it, you make nice beautiful ways to get information out. And then people see the data easier and faster. That's the extent I'm going to go into the data warehousing at this presentation back to the PowerPoint. So that was a kind of an example of a data warehouse in SQL. Now, once you have a data warehouse with all the pros and cons we discussed so far, I'm going to show the benefits or talk about the benefits of using tools like Tableau and Excel to get the data out of the data warehouse. So the first main benefit is, well, now you're hitting a reporting database, you're now hitting the source system and then it's easier, you know, when you look at the, when you look at this output here, if you're using Excel or Tableau, you know, as a user you just see these beautiful names, these values, and then you just run with them. You don't have to understand the back end. It's all nice and clean. So it's easier to do data analysis, it's faster. You know, again, when you run things out of the data warehouse, usually it's going to run in seconds, not minutes and hours. If you don't run out of the data warehouse, the data can be consolidated. So when you look at your data, you can see everything that is related together. Yes, you might need to ask the data warehouse person to make tweaks to combine data. That's a one time setup that this more technical person will do on the server. Once this person gives you a new data set in the data warehouse, the data is combined, it's automatically calculated, it's prep and you just have to get it out into Excel or things like Tableau. So data consolidation is a big benefit because you don't have to do at the ui, you do at the database level. Single versus the truth I already told you about. You know, in data warehouse, single place where the metrics are, you just pull them out so you don't have to calculate over and over and over in your reporting tool. Typically you can set up automatic refreshes. So once you have a report in Excel or Tableau and a user wants to see this report when they open is automatically refreshed. You can actually build in this framework something that users don't have to refresh the reports. The reports are always refreshed automatically. So it removes mechanical parts out of the process. Data governance. Many times you have a lot of users you might be concerned about who should see what data. How can you control that these people are going to access only the data that they can? How can you control that people will not get the wrong data at the wrong time or lose control of the data. And when you are concerned about data governance, then there's a lot of possibilities. Typically Excel, Excel is A tool that gives you less options for data governance. Because once the data is in Excel, is in Excel, right? You can email the Excel someone, you can have the Excel in your I know your notebook, maybe the notebook is stolen. And guess what? All the data is in Excel inside of your notebook. Using tools like Tableau, there's a lot more layers of data governance in a way that let's say you prevent people from downloading data. They can view the data on screen, they can slice and dice it, maybe they can print it, but it's not sitting there on a file on the local hard drive. So when it comes to data governance using Tableauxl and data warehousing, you have more controls to be sure your data is refreshed and protected as you decide. So let's take a quick look how Excel works when you pull data from a data warehouse. So remember, you know, I showed you before the data warehouse and a little bit on the technical and the business side. Now suppose I'm a user, I don't know about data warehousing. I let someone else take care of it. I just want to be sure that when I pull my data it's easy for me, that's where you can control security and whatnot. But I'm going to go as a user and say I want to build a refer from scratch. Suppose I know how to connect. This could be all pre configured, but I'm going to show you how I'm going to be pulling the data manually for the first time. So when you connect to my data warehouse, the data warehouse can be on premises, can be in the cloud, there's all of these options. But when you connect to your data warehouse in Excel, then you'll get all the data structures available from the data warehouse and this can be secured. Maybe I can see everything as a business user, maybe I shouldn't see all the fitting tables. I should only see tables that are friendly to me. So when I select my sales, I already see sales beautifully described. I just click load the data and the data comes right into Excel. So pulling data from a data warehouse for Excel, easier, more secured, business friendly, all the backend is maintained by data warehouse people. As a user I don't need to learn those things. I just get a data to Excel and I run with it. As I mentioned, what I just did can be automated. So if I'm a business user that I don't want to learn how to connect to database or not sure the business analyst will build this report, will save it will give me security to the data warehouse behind the scenes. As a user, I open this Excel report and boom, the data is refreshed automatically. I don't have to do anything except make more informed decisions. So it can be that easy. All right, so that was a quick demo of Excel pulling data from a data warehouse. And you can do now anything in Excel. You can do sales reporting, inventory reporting, financial reporting. You can see data combined from your Sage X3 with your CRM, Google Analytics, HubSpot, whatever you have, all combined in the data warehouse. Now Excel becomes easy faster to get the information done. All right, let's talk about Tableau with its own natural language query and drag and drop reporting out of a data warehouse. So right now we're kind of even jumping further. I already showed you how using a tool like Excel, you can easily connect to a data warehouse. Now I'm going to show you how that's done in tableau, assuming that it is already connected. So I'm already skipping that step. I'm going straight to tableau and do natural language query in drag and drop reporting. So right now I am in a tableau web portal that is connected to my sales data coming from Sage X3. And as a business user, suppose that Excel is too complicated to me. I don't know how to do things, but I know how to ask questions in English. I need to know English. You know, there's an only requirement is needed to know English in being able to articulate the questions. And I just type it in a question. Sales by salesperson in 2020 20. So I ask a question just like when I do in Google or Bing. The tool give me hits. I read which one matches my question when I selected. The tool will use natural language, artificial intelligence and machine learning to try to answer your questions instantly and accurately. Whatever you ask, the tool will give you. Like in this case, salesperson is showing sales in a descending order in 2020. So the magic is having the data set properly mapped as a tableau data source. The user understanding how to ask the questions in the tool will do the magic. It's not magic, it's technology. And if I say by month again, the tool will try to understand. My question will give me options. I select the right hit. And now the tool converted sales by month in 2020 by salesperson using a line chart approach. That's easy. Maybe I want to see a tax table instead, like in Excel. I don't like charts. Let's say I select tax table and now the same report showing sales by salesperson by month. Maybe Now I want to export to Excel. Sure I can select the data points and then I tell the tool show me only these data points. But you want to see all the underlying data. Every oopsie I clicked the wrong button. I want to see all the columns of this, you know, all the transactions lying behind these data points. I want to download to Excel and now I have all the transactions to Excel and what I just was looking from natural language exported to Excel and now I can do further data analysis. So natural language is an amazing technology, is about 5 years ish old. It's not a magic wand. It's not going to answer all the questions. You need to know how to ask the questions and once you ask correctly it will give you instant accurate answers. Many of our clients they're not using natural language, they're not ready yet. But we also have many clients that are running with it in letting many business users be more self sufficient. Something that before they were completely relying on someone else to get the answers from their questions. Now they use natural language to find the answers by themselves. Very empowering. So natural language framework is amazing and I'm using and showing the tableau functionality. The next one is drag and drop reporting using Aussie tableau. So once you get the data to the data warehouse and you get tableau connected to your data warehouse, pretty much what business users or business analysts they can do, they can learn as to how to drag and drop reporting components into a report. So right here I have my sales data out of my X3. I can see long descriptive business names. They're all behind the scenes connect to the data warehouse. And if I want to build a report, let's say I want to see sales by customer in a given period I pretty much have to drag and drop. I take customer, I put in my rows. So these are my customers. I want to see sales, I get my sales putting my report. So drag and drop total sales by customer, I want to see by year. So I'm going to take my invoice date put in my columns. So right now I'm seeing buy customer sales by year and maybe I only want to see a few years, maybe a small data set I can make a filter out of my years. It goes to the right and now I can tell only show me my last two years. That's it. Sales by customer for the past two years. Tableau, drag and drop is one of the most empowering and self service kind of reporting tool out there. If you look at the the comparison tableau continues to be the gold standard. We have many of our clients that they started to use Tableau as the reporting tool. And many business users learn to become self sufficient without formal training using the natural language in the drag and drop. If you got the basics sometimes out of a demo, you can also start building reports and dashboards. Absolutely true. Now to become really proficient in becoming like a data geek, doing a lot of more complex and sophisticated reports and dashboards, it will take more effort to learn all the possibilities. But the basics of Tableau are really easy to understand and very empowering. All right, so that was a quick tableau natural language query demo with drag and drop reporting. Now let's assume that you understand the basic of the data warehousing, how it works, the benefits, the pros and the cons. You saw how you can use Excel and Tableau out of this framework and you want it and you don't have it today. So should you do it yourself, start from scratch, or should you get a subscription from a vendor to get started? Well, let's talk about it. Absolutely. Both approaches, very valid. Many companies going one or the other direction, many companies sometimes switching between one direction to another. So this is no rocket science, but if you do it yourself, first of all, you need people. I'm not talking a person, is typically people that will know how to get this done properly. Do you need a lot of people? Depends. Sometimes a single person can do everything. Absolutely. If you have someone that can do everything, let me know because we're hiring and we want that person. But anyhow, you need people who understand your Sage XP database that understand data warehousing concepts. They don't need to be again, a rocket science person, but they need to have the basics on the back end of the system. Typically that's a person, sometimes two people, people who understand x3 and understand data warehousing in whatever platform you decide. Then typically you have another person that knows the front end tool, Excel, Tableau, Power, bi. Whatever you choose, it's usually another person and then these two people together. Usually they can do the magic. So if you do it yourself, be sure you find a person or people that can help you connect the dots and make this work seamlessly. You need to design the tools if you don't have them yet. Sometimes deciding the tool tools, you know, it requires some expertise to see the options, choose the right ones. You know, it's sometimes people spend months, even years to find the tools, but hey, you know, it's part of the decision of doing it yourself. It takes time. Typically building from Scratch, you know, I've seen cases, weeks, months, years. It depends on your priorities. It depends on how much time available you have. Depending on the people's skill sets do already know each other, they know how to work with each other. So time is also variable. A lot and return on investment, how long is going to take, how much money is going to get the job done? One of the things I encourage you is if you decide to do it yourself, do your best to retain these people, whoever you involve to get the maintenance of your BI platform, do your best to retain this person or these people because if they leave the company and no one else knows what they did, good luck finding someone else to replace a person in catching up with all the mechanics. So that's one of the biggest recommendations. Be sure you do your best to retain the people who are doing your data warehousing and analytics. So those are the considerations when you do it yourself from scratch. If you subscribe and there are many vendors out there providing data warehousing, providing analytics, sometimes it's a VAR is a company who does servicing the components and they offer a package. Sometimes you get one component from a vendor, another component from another vendor and you get a consultant to join the pieces. There are many options out there. Be sure to check your options. Usually when you get companies that do this for a living, typically it will be faster to see results. Sometimes you can see the results in minutes or hours because the solution plug and play and you get some value right out of the box. So typically the ROI is much faster. There's a lot of things pre configured plug and play get the system up and running. Very big value, ongoing support because let's say you're probably going to have some people, maybe a person in your team or maybe you're hiring some people to help with this. And again sometimes these people that you have in house, they're not Experts in the x3 or in data warehousing or the tableau, Excel security, data governance, all those different components your people might not be aware of. Typically the vendors who provide you solutions, they also provide you services to complement your own skill sets of your team. They can also train you in things that you need specifically for a business. So ongoing support from these vendors are usually very critical for the success and fast return on investment on an ongoing basis. The last step that I recommend you to look for is see if the vendor provides you with transitioning options in case you decide to disconnect from the vendor. What will happen with your BI solution? Many vendors that means scratch IT buy something else and start from scratch. So I encourage you to work with vendors that if you decide by any chance to take it over completely, you want to do all about yourself, you can do it without scratching it, without, you know, throwing away whatever that the vendor has provided you with. So this is also a long term good strategy to have a backup plan in case you decide to take over the whole process. So those are the considerations for do it yourself versus subscribe. This first half an hour, I'm just talking about education overall about all of these things. Now I want to talk about what Data Self. You know, we are a BI vendor. We have our own technology, our own services, our own support. And I want to show you how we actually accelerate the time that it takes to get data warehousing right in Tableau and Excel right out of the box with Sage X3 and how we can support you to be more successful with this kind of project. So first of all, how is our architecture? Just like I showed you before, these will be your source systems and we can pull data out of your X3 and several other data silos right off the box. We use SQL Server as our data warehouse platform. It's an amazing platform. SQL Server is one of the most successful data warehousing technologies out there. And we use our own ETL tool, it's called ETL plus, to make it easier, faster, more intuitive to deploy and to maintain the data warehouse. Then typically we provide Tableau and Excel as the two main tools for the analytics layer. We also support Power BI in a much simpler capacity. But anyway we support those three and out of the box we have a lot of reports and dashboards. If you go with the entry level version, we have dozens. If you go with the enterprise version, we have thousands of reports and dashboards ready to go. You know, looking at your actually for financials, receivables, payables, sales, inventory, purchasing and a lot more other things, manufacturing, whatnot. And with Data Self you can go completely cloud solution, you can have a hybrid framework, or you can have everything on premises. So we're here to assist you to be successful with your BI journey. And that's the technology and architecture that we use. Data Self ETL plus. What's all the fuss about? ETL stands for extraction, transformation and loading. So it's typically the mainstream technology used by companies to do data warehousing in an easier, better way. We are an ETL company at the heart. We've been doing this for 15 years. But about three years ago we decided to redesign our ETL from scratch and we launched last year ETL Plus. So it's an amazing ETL framework. It's simple, it's amazingly powerful and even though it's fairly new, it's about five, six months old, it's already so much better than our old ETL in so many ways. It's an ETL designed for the future, designed for cloud sources for on prem services and all this complexity of data we have today's world. There's a lot of great benefits we're building into ETL plus just to give you a quick show of what the ETL plus today is. So this is ETL plus. The current version is driven by what's called SQL Server statements. So in order to maintain you have to have very basic knowledge of SQL Server statement. If you know SQL Server statement, then you're going to find this to be an amazingly empowering tool to do extraction, transformation, loading. We are working to have also wizard driven ui so you can actually make a lot of these changes of the ETL without knowing SQL. So there's a lot of great things coming out of the etl, but pretty much you can see your source system here. This would be your sage x3 or the data sources. These are the tables that you bring to the data warehouse and these are the SQL Server statements you use to bring. Do the magic kind of tech talk for some of you, but I'm going to cut it short very quickly. Some of the big benefits as well as the ETL is that you can do delta refreshes. Like in this example, I'm looking at one of the X3 tables that's typically pretty large. And we can use what is what we call update refresh. What does that mean? The first time we extract this table to the data warehouse, we pull everything. It might take a while to pull everything over. Yes, but after the first refresh, when we refresh this table, it only bring the deltas, only the records that have changed since the last refresh or new records. And using the update refresh, we typically can refresh your X3 and any other data source dramatically fast, will not impact the performance of your source system, and will continue to run fast, verify reports and dashboards. So there's a lot of cool technology around the TL plus. I'm not going to dive too much into it today, but just to give a perspective, if you want to refresh your data warehouse, you can do this automatically. You can schedule, you can schedule when to refresh, what to refresh, which tables do not refresh Everything, do not refresh deltas, all those things are configurable. And refresh is pretty much you tell the tool to refresh, refresh now and the tool will just start to spin it and take all of your tables from your source system and push to your data warehouse. Being the cloud or being on premises, you will just do the magic quickly and easily. All right, so that's the main thing about ETL plus I'm going to do now in the next 5 minutes a quick demo on Data Self analytics. So if you start with Data self for Sage X3, pretty much you get an out of the box solution that comes pre configured to a lot of reports and dashboards to X3. And this is an example. We can see sales, we can see inventory management, sales order, inventory, manufacturing. If you want financials, payables, receivables, you can bring, you know, other data sources. A lot of the things here are plug and play. Pretty much in half an hour we can the system up and running and you can have natural language. You can see a lot of reports and dashboards ready right out of the box. This is one example showing year over year sales out of Axwi. And yes, you can absolutely have this dashboard as soon as we deploy out of the box. And as a user you just need to select these filters, apply different things and you see the change happening in front of your eyes automatically, instantly. And it's all interactive. This is tableau functionality. Hey, I'm looking at my customers sales last year, this year in the variance and when the customer is declining, what's happening with this customer, I click on that customer and the whole dashboard changes to give me the details of this customer, the sales by period, by ship to and all the product sales details. Again we have lots of reports and dashboards available out of the box. Another one that is popular, Daily Flash. The idea here is for management to know things as they happen. You know, we hear a lot of decision makers complain that they got to know important things in their business days, weeks, sometimes months after the fact. While Daily Flash can show you in any part of the business what's important and then you can see every day what's happening. And if there's something important, you drill down. If nothing's important, you just go about your day just showing a few more examples here out of the box. Also you can see financial information, P and L balance sheet, GL charts and dashboards. So overall we have a lot of things out of the box for Sage X3 in several other data silos. So That's a very quick demo of the Data Self out of the box for X3. So what about time to deploy Data Self in pricing? Well, we have two main versions. One is called Advanced analytics and it takes 30 minutes to deploy a lot of the things that I show you today here overall in this presentation, many of those things, not everything, but many of those things will be available right out of the box after a 30 minute deployment. By the way, the price here starts actually at 499. Let me just fix this right away. Was a mistake. This is for another product I was working on. So the pricing for X3 starts at 499 per month subscription and it comes with a lot of reports and dashboards ready right off the box if you decide to go with the enterprise analytics, which so far is very common for X3. When people come to Data Self it's just because they're not happy with the AX3 built in reporting tool. Then typically they start with the Advanced Analytics. They love it, little money and most of our clients so far they have moved to enterprise where it takes a lot more time to deploy. There's a lot more value, there's thousand reports and dashboard out of the box and the subscription starts at 199, pretty much $2,000 per month. What's next? If you want to learn more about what I covered today, we're recording the session. So we're going to be sending this video tomorrow, this video recording. But you can go to dataself.com there's a lot of materials around what we do. You can contact us here. If you want to order Data Self, call your var, call dataself or you can order directly@dataself.com let me very quickly show you where to go. If you go to dataself.com so thisdataself.com you can click sage in sage x3. To learn more about sage x3 you can click on Industries and select your industry and watch a full hour webinar around value for your industry. So I encourage you to watch these videos as well. At the bottom of these pages we also have sample reports. So if you want to see what comes included with Data Cell physample reports and you're going to see screenshots of a lot of reports and dashboards available right out of the box. And if you decide to order Data Self, you can, let's say go to Sage Sage X3 and you can click the order now. Deploy analytics now and you can order your Data self straight out of our Website. All right, with that, having said, I'm going to open the Q and A. But just before I do that, what Data Self brings to the table here is we bring a pre configured data warehouse reports and dashboards using Tableau. So instead of taking a lot of time to do it from scratch, in 30 minutes you can get started for very little money. Because we use this latest and greatest technology is easy to use and easy to customize reports running seconds no matter how much data you have. It's really amazing and empowering. This framework typically automates reporting tasks including the distribution reports. People don't have to go to pull the reports. The reports can come to their email automatically on schedule. So those things are also part of our framework and the technology we use is powered by Gartner endorses BI components and that's part of the discussion. If one day a company, a client of ours decides to take over and do it all themselves, they typically they don't have to scratch, they just have to continue to use SQL Server, tableauxl whatever the tool is they get, they kind of buy our templates and they run with it. So we do not lock you with our business. We are here to make you successful and retain your business year over every year. With that, having said, I'm gonna open the question and answers. We only have about a minute before we wrap the session, so let me just see if we have some questions and address at least one of them. There's a question here from Carl. Do you also support Power bi? Carl, thanks for your question. Yes, we absolutely also support Power bi. Truth to be told, we've been working with tableau for almost 10 years now. Actually been 10 years now. So we have a much more comprehensive out of the box solution with Tableau. With Power bi, we've been working for about two years. We have a lot less out of the box. But we are data geeks and we will love to support you in case you want to get great data warehousing out of x3 and use power BI as your reporting tool. All right, we're running out of time, so here's my contact information again. By tomorrow you should receive a recording of the session. Thank you very much for your time and interest. Feel free to reach out in case you want to learn more. If you want to discuss your data geek ideas and plans and if you decide to do business with Data self, boy, we'll have fun. We'll help you will be successful. We are crazy about data and we're here to help. And if you're happy. We're happy, too. Thanks for joining. Have a great day. It.










