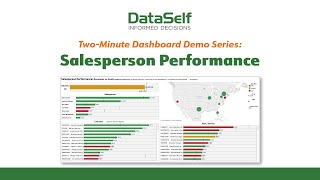
DataSelf AI's Salesperson Performance Dashboard compares reps against their individual goals, not just rankings. Top rep Steve Church and Kasheen Williams show how relative performance differs from absolute numbers. Drilling into Kasheen's data reveals concentration risk: two clients drive most revenue, and one product accounts for roughly 20% of her total.
Chapters
Salesperson performance. It's an obvious KPI, but many reports and dashboards lack two key relativity and drill down. Look at the current dashboard. Steve Church is our leading sales rep, but note the dotted black line representing his sales goal. Although Steve's done well, the fact is that the next sales rep on the list, Kasheen Williams, has done even better in relation to her goal. So let's talk drill down. Although Steve and Kashin have both exceeded their goals, have they done so due to consistent sales across their client base? Or is their success due to just one or two high volume clients? Let's drill down into Kasheen. We now see that Kashin's numbers are primarily a result of just two clients, Elevation Computers and Agrolink Foodcorp. Although it's good to see those numbers, it's also a bit concerning as it shows that Kashim's success is not well distributed among a multitude of clients. So let's drill down even further to the details behind Elevation Computers purchases. Once again, we see details that are both informative and a bit unnerving. Behind this client sales is a single item, Little Tyke's bold and bright tables and chairs that accounts for almost half of of Kashin's revenue from this customer and approximately 20% of her total generated revenue. Drill downs like this allow us to better understand where sales are coming from and perhaps even more importantly, where they're not. Armed with such insight, we can implement policies and strategies that maximize the potential from high yielding clients and products, while minimizing the potential impact should such clients and products face fail to continue their success. Oh, and using the window at the top right, we can even evaluate sales from a geographic perspective, enabling us to identify both hot and cold regions. So to know more than just how your sales reps are doing, to know the why behind them, the Salesperson Performance Dashboard is the first place you need to look.